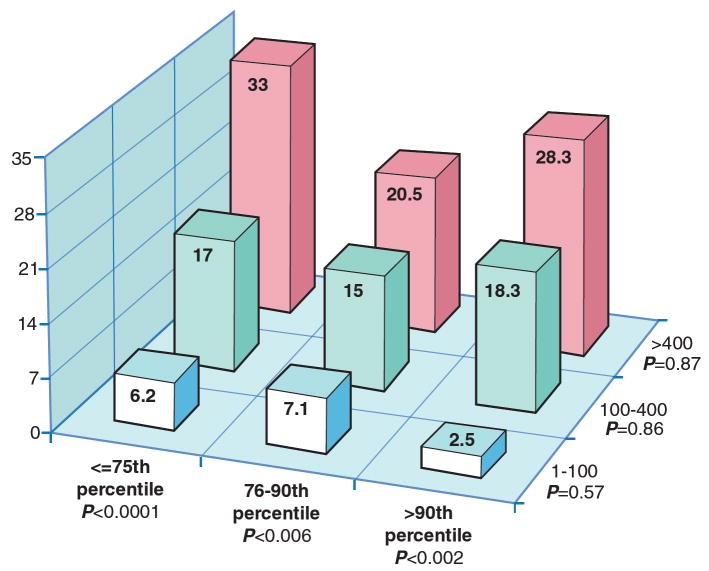
Fig. 2. Rates of incident CHD per 1000 person years at risk by joint categories of absolute CAC group and age/gender/race specific percentiles.
Within a particular level of age/gender/race/ethnicity specific percentile, there remains a clear trend of increasing risk across levels of the absolute CAC groups. In contrast, once absolute CAC category is fixed, there is no increasing trend across levels of age/gender/race/ethnicity specific categories.

