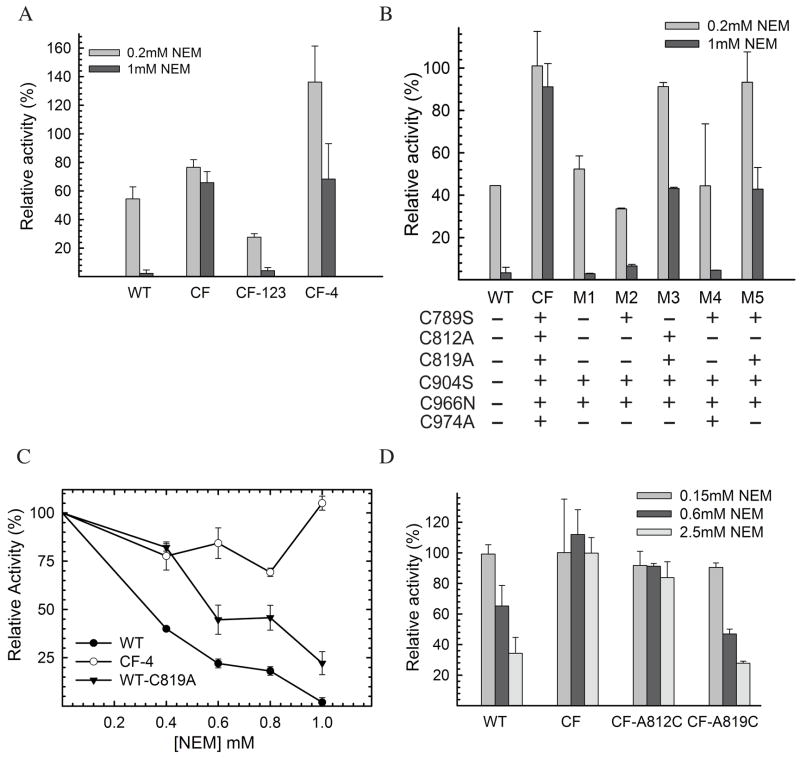
Figure 4.
NEM sensitivity of human IDE. Relative activities of IDE-WT, IDE-CF, IDE-CF-123, and IDE-CF-4 (A), and of IDE mutants M1-M5 (B), are shown at two concentrations of NEM (0.2 and 1 mM). Activities were measured after 1hour incubation of IDE samples partially purified by a small-scale protocol (see Experimental procedures for details). (C) NEM-concentration (0–1 mM) dependent relative activities of IDE-WT, IDE-CF-4 and IDE-WT-C819A. (D) NEM sensitivity of fully purified IDE mutants at three different concentrations of NEM (0.15, 0.6, and 2.5 mM) after 1 hour incubation. Samples shown in panel D were fully purified, in large scale, as previously reported (12) to exclude effects of contaminant from less purified samples. Relative activities are reported assuming as 100% the control reaction were each sample was incubated with buffer only. Incubations were performed mixing 1mg/ml purified IDE samples with the shown concentration of NEM, and activity was followed by measuring fluorescence as resulting from the cleavage of 0.5 μM Substrate V.

