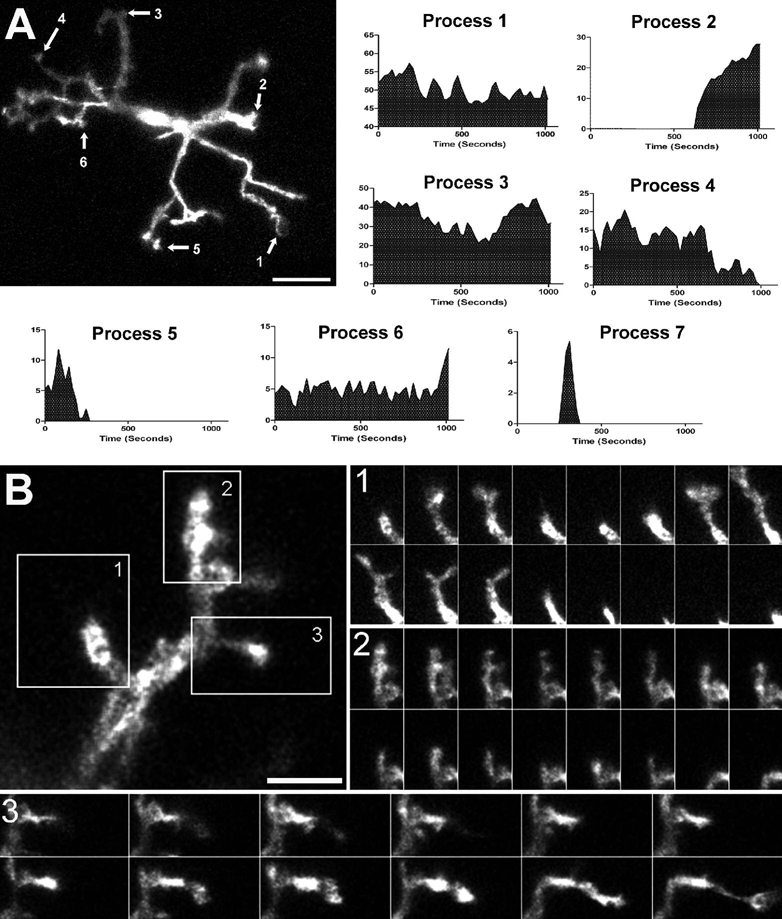
Figure 2. Resting retinal microglia show marked process motility.
(A) Microglial cell in a CX3CR1+/GFP mouse retina imaged with time-lapse confocal microscopy. Length-versus-time profiles for each cellular process (indicated by arrows and numbered) demonstrate extension and retraction movements. Scale bar = 50µm. Process 7 was transient with a short half-time (not located on figure) [Supplementary online material, movie S1] (B) High-magnification confocal image of a single microglial process bearing multiple tertiary terminal processes. Image series in insets (taken 10s apart) show progressive structural changes in existing processes, de novo initiation of processes, and complete elimination of existing processes. Scale bar = 5µm. [Supplementary online material, movie S2]

