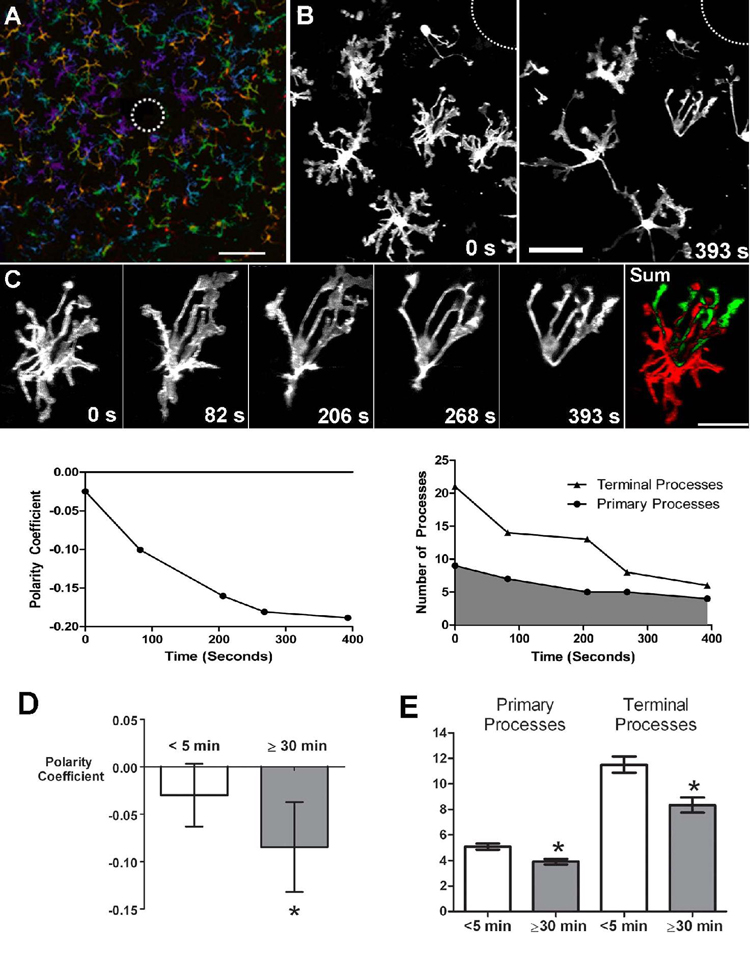
Figure 5. Morphological responses of microglia to focal laser injury.
(A) Low magnification (20X) view of microglia in the vicinity of a focal laser burn (dotted circle) with colors representing depth in the Z-direction (purple=superficial and red=deep). Scale bar = 100µm. (B) Higher magnification of microglia at the edge of the laser burn (dotted circle) immediately (left) and 393s after (right) laser injury. Scale bar = 30 µm (C) Cell from inset in (B) showing progressive morphological change in response to laser injury. [Supplementary online material, movie S5] Subtraction image (right) between the initial and final images demonstrate that processes are extended in the direction of the laser burn (in green) and withdrawn on the opposite side of the cell (in red). Scale bar = 20µm. Graph of polarity coefficient vs. time after laser (lower left) demonstrates increasing polarization of the cell towards the laser burn with time. Graph of process number vs. time (lower right) shows decreasing number of primary and terminal processes after laser injury. (D) Polarity coefficients of multiple microglial cells immediately post-laser injury (0 to 5 min) and after a waiting period (30–70 minutes). Error bars indicate 95% confidence intervals. Cells were slightly but not significantly polarized <5 min after injury but became significantly polarized (p < 0.05) after 30 min. (E) Numbers of primary and terminal processes per cell are significantly reduced after 30 minutes post-laser injury (asterisks indicate p <0.05). Analysis of (D) and (E) based on 153 cells from 24 time-lapse recordings in 6 animals.

