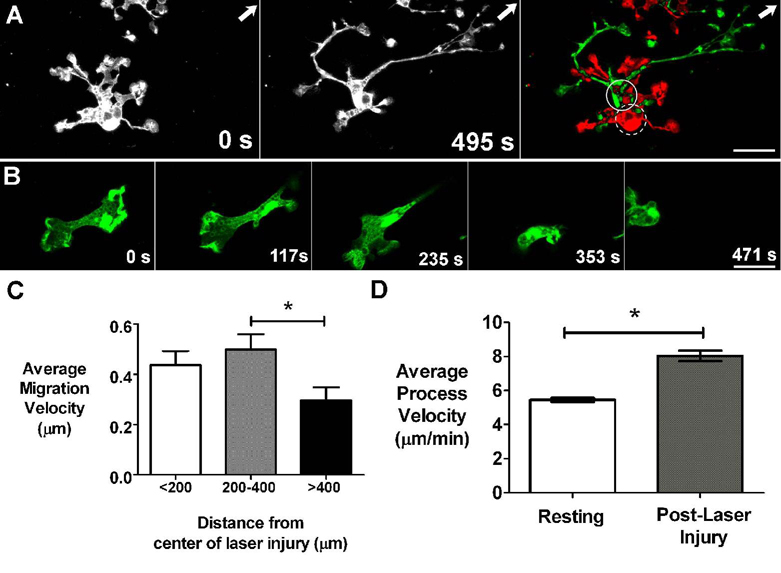
Figure 6. Dynamic behavior of microglia after focal laser injury.
(A) Microglia cell in the vicinity of laser burn (arrow indicates location of laser burn outside image field) soon after laser injury (t = 0s) and approximately 8 minutes afterwards (t = 495s). Subtraction image (right) between these 2 time-points shows displacement of cell body position (dashed and solid circles indicate soma position at 0s and 495s respectively) in addition to a progressive extension of processes towards the laser burn. [Supplementary online material, movie S6] (B) An amoeboid microglia is seen near the laser injury site and migrates across the imaging field. [Supplementary online material, movie S8] Scale bars = 15 µm. (C) Average migration velocity of ramified microglia at different distances from the center of laser injury. The average rates of cellular migration is similar between cells up to 400 microns away from the center of laser injury, but cellular migration decreases significantly with distances greater than 400 microns from the injury site (asterisk indicates p < 0.05). (D) Average velocity of microglia processes after laser injury (n = 363 processes from 99 cells from 12 recordings in 3 animals) increased significantly (p <0.05) compared to that in the resting state (n = 363 processes from 37 cells from 7 recordings in 3 animals).

