
Fig. 1.
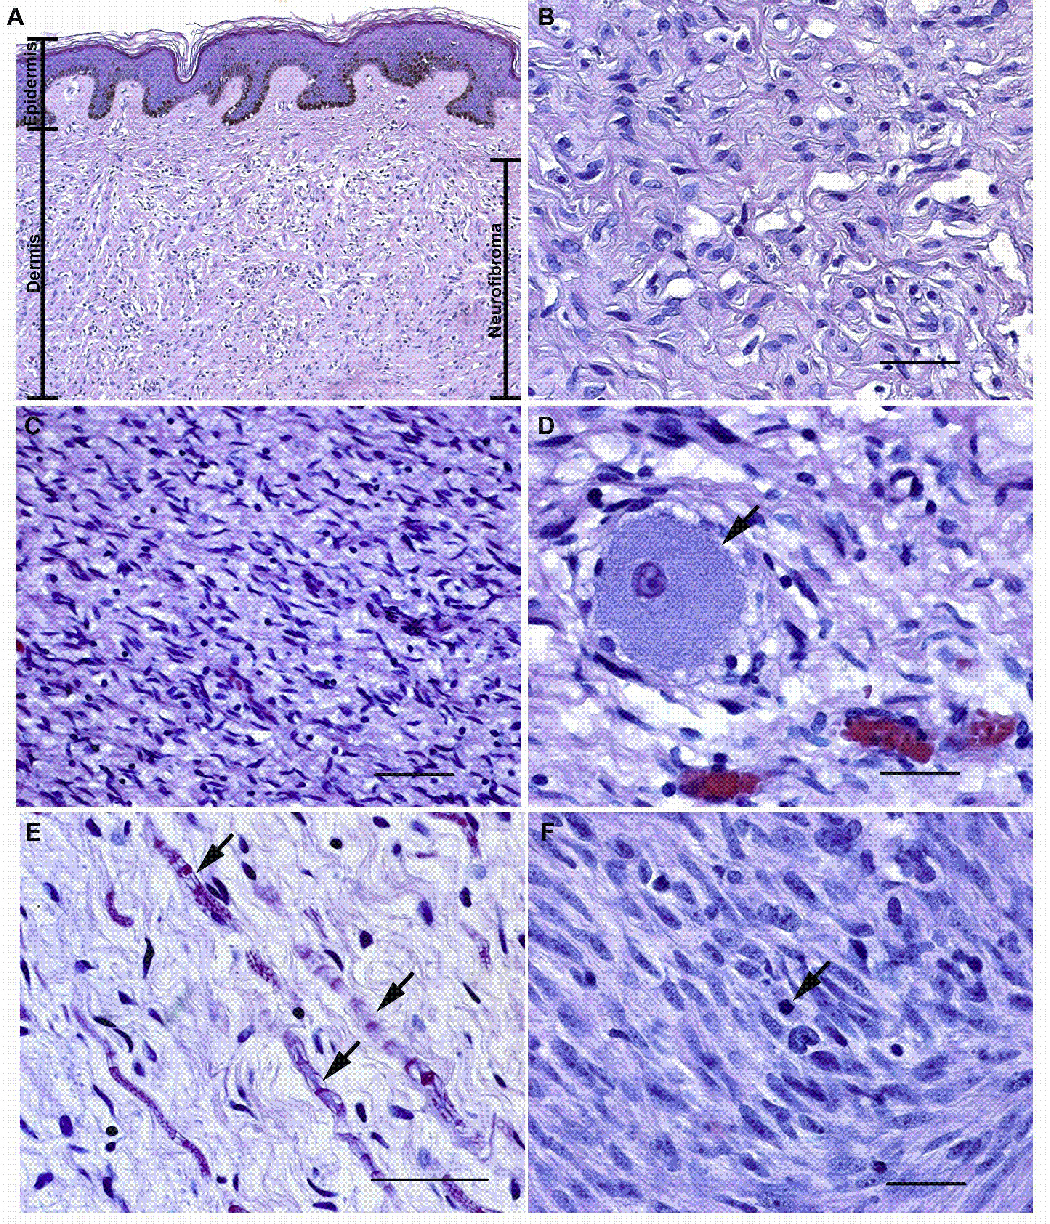
Microscopic anatomy of NF1-associated peripheral nerve sheath tumors. (A, B) Panel A illustrates a low power (10x) view of a localized cutaneous neurofibroma that presented as a pedunculated mass on the left shoulder of a 60 year old woman with NF1. This tumor (indicated by the bar on the right of the panel) spanned almost the entire thickness of the dermis and infiltrated into the underlying subcutis (a layer of loose fibroadipose tissue underlying the dermis; not shown in this image). Note that the tumor does not involve the most superficial portion of the dermis or the overlying epidermis (the maximal extent of the epidermis and the dermis are indicated by bars on the left of the panel). Panel B is a representative hematoxylin and eosin stained high power (40x) field from this densely collagenized tumor. (C, D) Panel C illustrates a low power (20x) field from a localized intraneural neurofibroma that arose in a cervical dorsal spinal nerve root. This tumor infiltrated diffusely through the nerve and associated dorsal root ganglion, destroying the normal fascicular architecture of the nerve as it produced a segmental fusiform enlargement of this structure. Panel D is a higher power view (40x) of this tumor. The arrow indicates a sensory neuron from the dorsal root ganglion that has been entrapped by the growth of the neurofibroma. (E) High power (40x) view of a field within a plexiform neurofibroma resected from a 40 year old woman with NF1. This tumor, like many plexiform neurofibromas, has a looser, more myxoid matrix but is still composed of the same cell types present in the tumors illustrated in A–D. Arrows indicate entrapped axons and their myelin sheaths. (F) An MPNST that arose within a plexiform neurofibroma in an NF1 patient. Note the greater degree of cellularity, atypia and mitotic activity (arrow) in this tumor. Magnification: 40x. Bars in B, D and F: 50 µm. Bar in C: 200 µm. Bar in E: 100 µm.