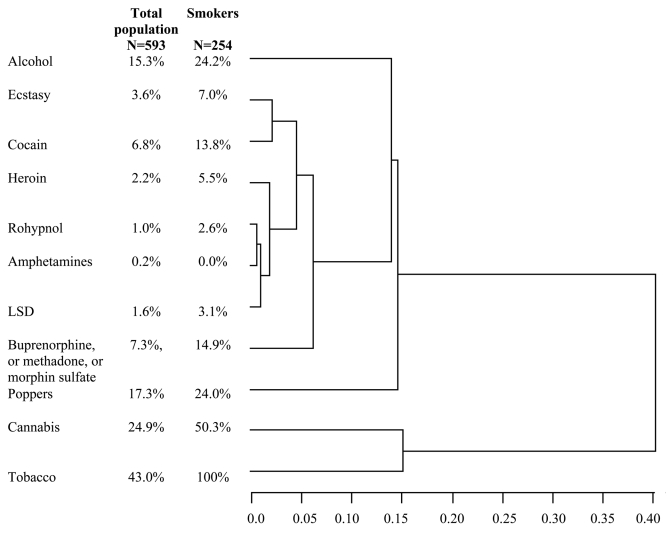
Figure 1.
Dendrogram showing the results of Ward’s cluster analysis: hierarchical relationships among substance abuse in the study population.
Note: Results are expressed by name of substance consumed, % of consumers among the study population (n=593), and among the smokers (n=254); LSD: lysergic acid diethylamide. The semi-partial R-square is an indicator of cluster isolation: high semi-partial r-square values indicate a high level of cluster independence.

