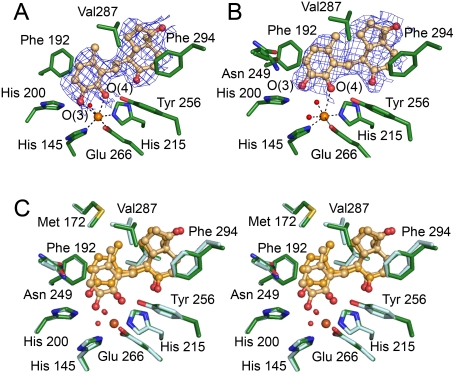
Figure 3. The binding modes of DHSA in HsaC.
(A) DHSA in molecule A. (B) DHSA in molecule B. The (2F o−F c) electron density (blue, contour level = 1σ) was calculated without ligand to remove bias. (C) Stereo view of a structural superposition of DHSA in the two molecules in the asymmetric unit. HsaC:DHSA in molecule A is colored in dark green/yellow. HsaC:DHSA in molecule B is colored in light green/orange.

