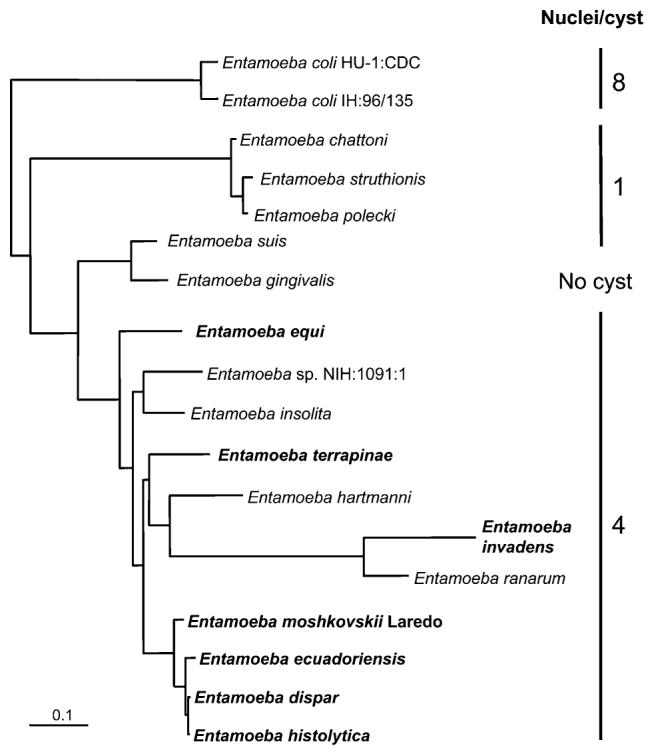
Fig. 1.

Phylogenetic relationships among Entamoeba species. The tree depicted is redrawn from that in Clark, Kaffashian, et al. (2006). Species producing cysts with different nuclear number are indicated. Species referred to in this work are shown in boldface. The scale bar represents the evolutionary distance equivalent to 0.1 changes per site.
