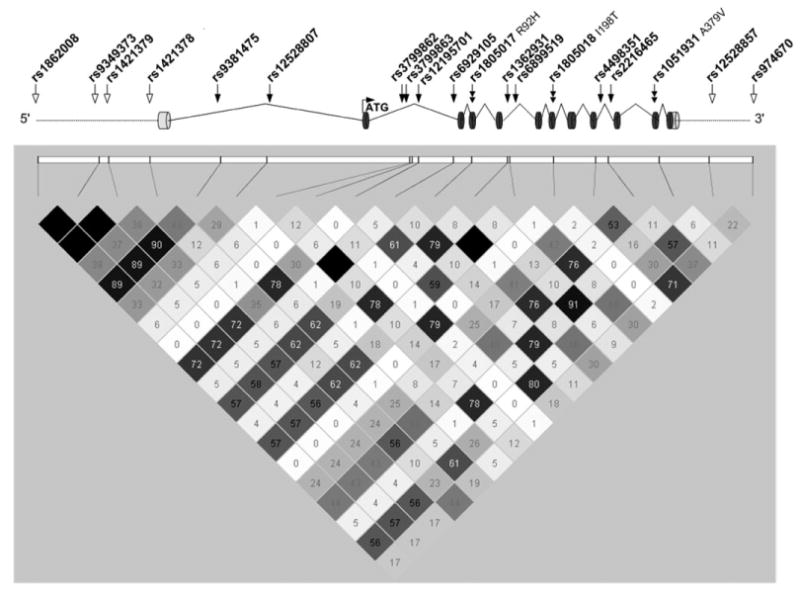
Figure 1.

PLA2G7 gene schematic and linkage disequilibrium (LD). Nineteen SNPs genotyped in PLA2G7 are depicted in the schematic and are placed according to their genetic location. Coding SNPs are denoted by a double solid arrow. Open arrow indicate intergenic regions, and solid arrows indicate SNPs located in intronic regions. LD plot was visualized using the program Haploview. R2 values for Caucasian control samples from CATHGEN are depicted.
