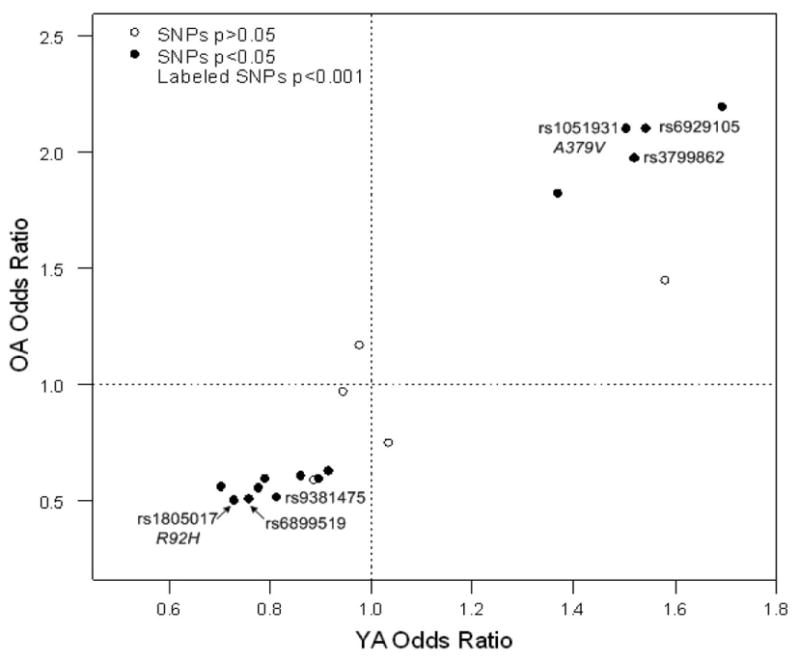
Figure 2.

PLA2G7 genotype odds ratio plot for old affected (OA) and young affected (YA) individuals. Solid circles represent SNPs with P-values of <0.05 in the OA, open circles represent P-values of >.0.05 in OA. Circles with a SNP name on graph indicate SNPs with P < 0.001 in OA. Odds ratios are adjusted for race and sex.
