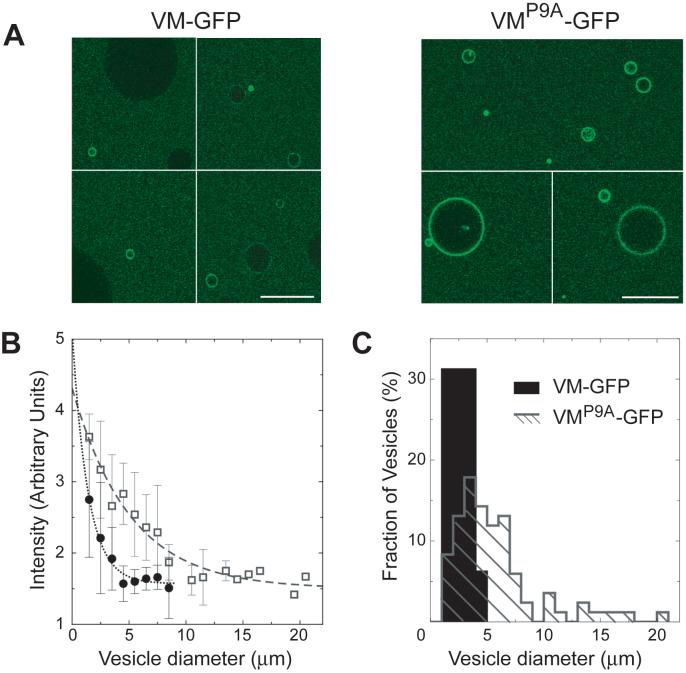
Figure 3. VM-GFP detects curvature in vitro.
(A) Confocal fluorescence micrographs of purified VM-GFP (left) or VMP9A-GFP (right) incubated with phospholipid vesicles. Scale bars are 20 μm. (B) Membrane fluorescence intensity as a function of vesicle diameter. Vesicles were incubated with similar concentrations of VM-GFP (closed circles) or VMP9A-GFP (open squares) The data points are mean +/- SD measured on N vesicles (N=3-18) and were fit with an exponential decay (11). (C): Size distribution of fluorescent vesicles whose intensity is at least 2.5-fold above background.

