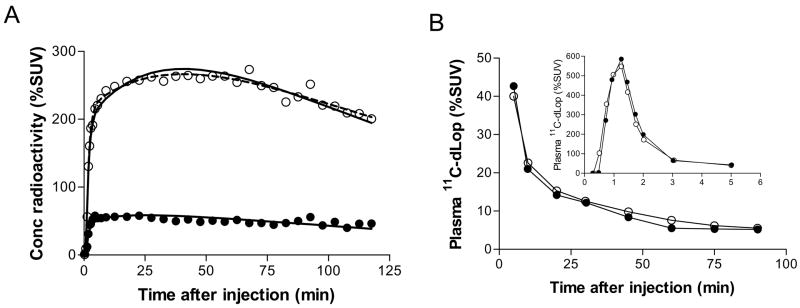
FIGURE 1.
(A) Time-activity curve after injection of 11C-dLop in the temporal cortex fitted with one-tissue (solid) and two-tissue (dash) compartment models at baseline (●) and after P-gp blockade (○) (DCPQ 8 mg/kg, i.v.). Only the one-tissue compartment model was used at baseline because of low brain uptake. All tissue curves were corrected for vascular volume assuming that blood constitutes 5% of brain volume. (B) Plasma parent radiotracer time-activity curve at baseline (●) and after P-gp blockade (○) in a single monkey

