
FIGURE 4.
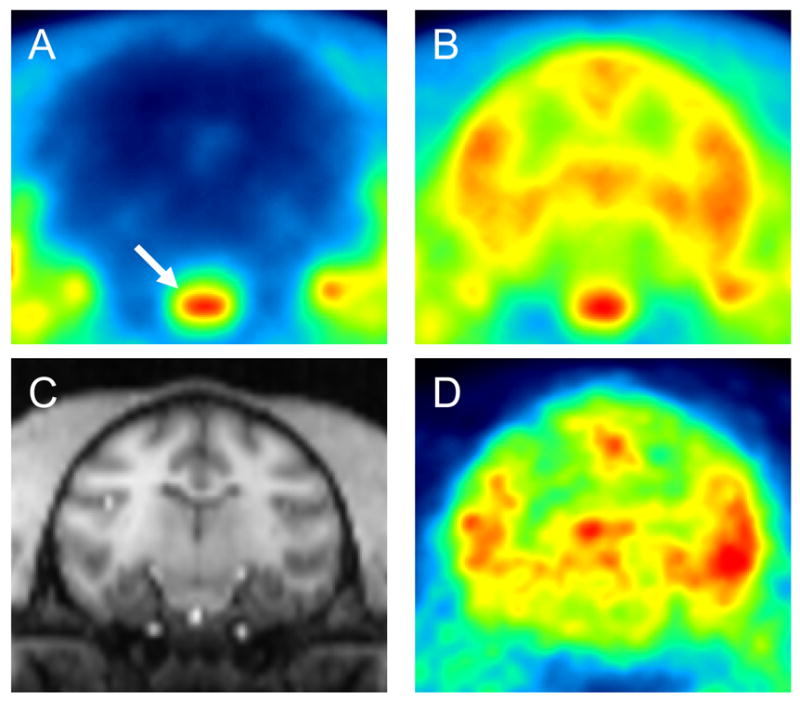
Total summed images (0–120 min) of 11C-dLop at baseline (A) and after P-gp blockade (B). At baseline, all regions of brain except the pituitary (arrow) had very low uptake. (C) MRI scan co-registered with the P-gp blocked image of the same monkey. (D) 15O-H2O scan of the same monkey showing blood flow pattern similar to that after injection of 11C-dLop (B).