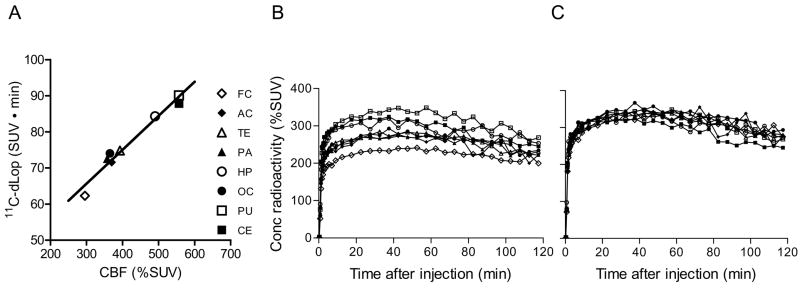
FIGURE 5.
(A) Correlation of cerebral blood flow and 11C-dLop uptake for eight brain regions in a single monkey after P-gp blockade. Time-activity curves of the eight regions before (B) and after (C) correction for blood based on the fitted straight line in (A). Symbols: FC (frontal cortex), AC (anterior cingulate), TE (temporal cortex), PA (parietal cortex), (HP (hippocampus), OC (occipital cortex), PU (putamen), CE (cerebellum).

