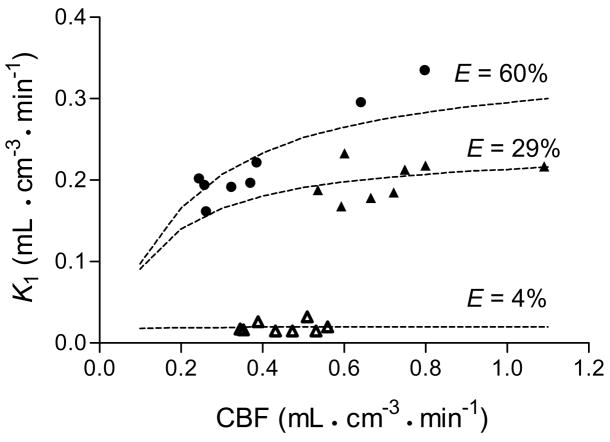
FIGURE 6.
Correlation between absolute cerebral blood flow and rate of brain entry (K1) after injection of 11C-dLop at baseline in one animal (▵) and after P-gp blockade in two animals (● and ▴). The symbols represent eight brain regions from each monkey. The curves show the theoretical relationship between CBF and K1 using equations (1) and (2). The theoretical values of K1 were generated using mean permeability and surface product (PS) calculated from CBF and K1 of the eight regions for each study.

