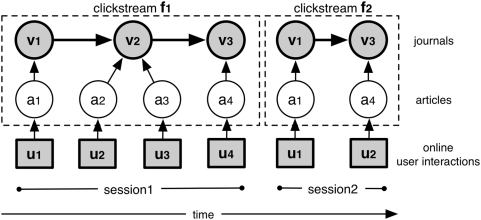
Figure 2. The extraction of journal clickstream data from article level log data.
Usage log data consists of sequences of timed interaction events  . Interaction events issued by the same user from the same client can be grouped in user sessions. Each user session represents a clickstream
  that can be expressed as a sequence of the articles that were part of the session's interaction events, i.e.
  . Since every article is published in a journal, we can derive journal clickstreams, i.e.
  . From the collection of all journal clickstreams we can calculate the probability
  .
.

