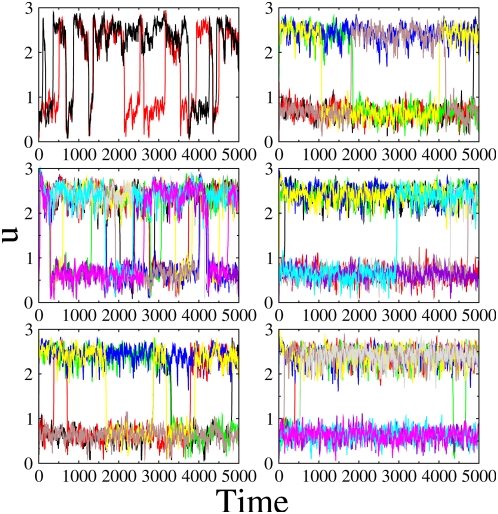
Figure 2. Time series for different number of cells with fixed noise intensity (σ a2 = 0.002).
The dynamics of u is plotted for different cells in different colors. From top to bottom, and from left to right: N = 2, 10, 30, 50, 500, 1000. The parameters are chosen so that cells are in the bistable regime: α1 = 2, α2 = 4, α3 = 2, α4 = 1, β = γ = 3, η = 1, ε = 0.01, d = 0.03 and de = 1.

