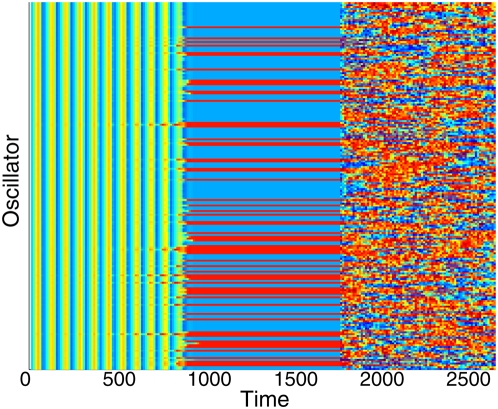
Figure 4. Effect of noise on a population of N = 256 coupled cells in the oscillation death regime.
The concentration ui is shown in color code according to the scale of Fig. 3. Time runs horizontally from left to right, while the different cells are plotted along the vertical axis, each cell represented by a horizontal line. Simulations were started with random initial conditions, and after a transient of around 900 time units (in which the oscillations are highly synchronous), two stable clusters emerge. At time t = 1800 noise is switched on with intensity σa2 = 0.4, and this leads to jumps between clusters. Parameters are α1 = 3, α2 = 5, α3 = 1, α4 = 4, ε = 0.05, d = 1 and de = 30.

