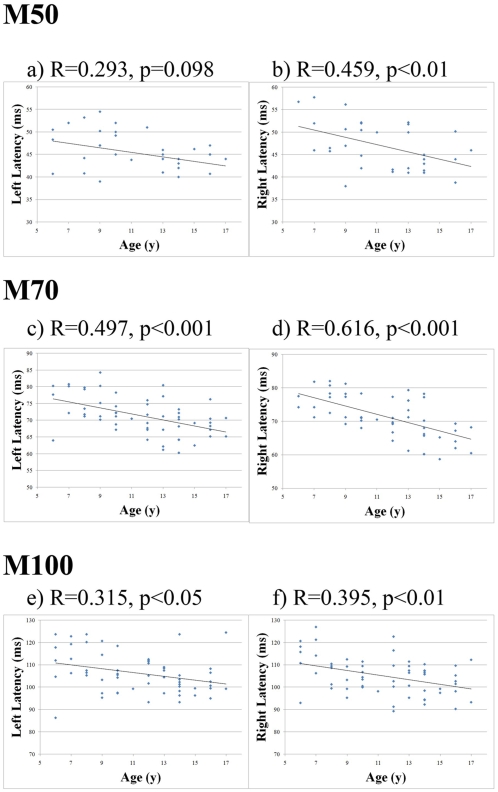
Figure 2. Scatter plot of the peak latencies of the M50, M70 and M100 components in the left and right auditory hemispheres relative to chronological age of the children.
Linear regression lines, using the least-squares method, are also plotted to show general trends for each hemisphere. The M70 components show a clear developmental change with the highest correlation coefficient.

