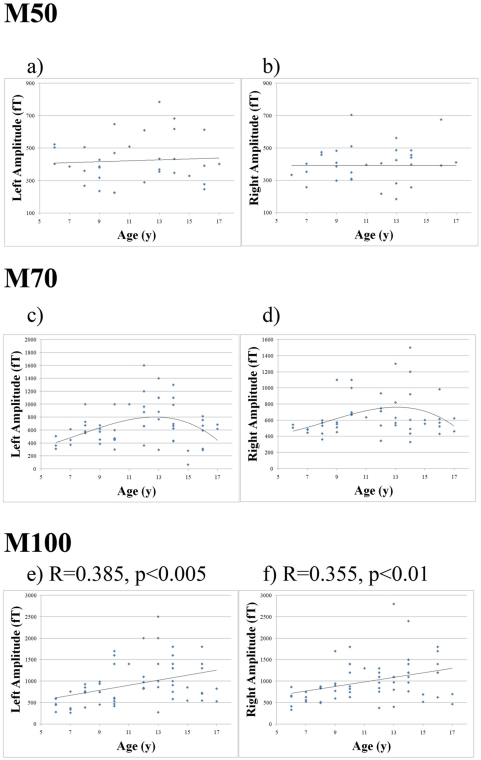
Figure 3. Scatter plot of the peak RMS amplitudes of the M50, M70 and M100 components in both auditory hemispheres relative to chronological age of the children.
The plots of “left amplitude” represent the left hemisphere; the plots of “right amplitude” represent the right hemisphere. General trends are also plotted for each hemisphere. Noticeably, the amplitude of M70 does not change with age linearly. Instead, it reaches the peak around 12–14 years old and then decreases with age.

