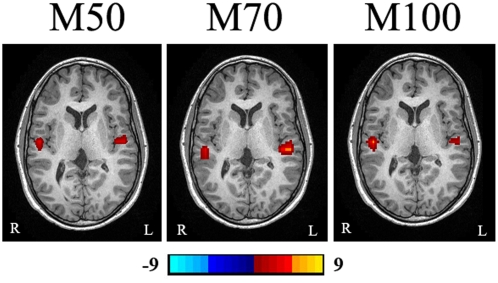
Figure 4. Magnetic Source Imaging (MSI) from mid-aged child shows that the M50, M70 and M100 AEF components are localized to subareas of Heschl's gyrus.
The location of M50 is anterior to that of M70. The color bar shows the strength of neuromagnetic activation. The “L” indicates the left side and the “R” indicates the right side.

