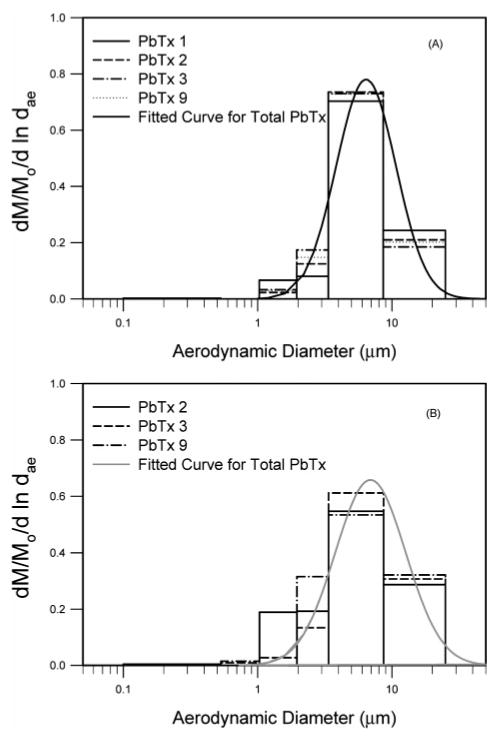
FIGURE 4.

Normalized red tide aerosol size distribution as determined from an impactor sample obtained at Siesta Beach on 3/29/2003 (A) and 5/3/2002 (B). The histograms are data for individual PbTx components. The fitted curve is for the total PbTx concentration with a MMAD of 6.4 μm and a GSD of 1.67 (A), and a MMAD of 6.9 μm and a GSD of 1.83 (B).
