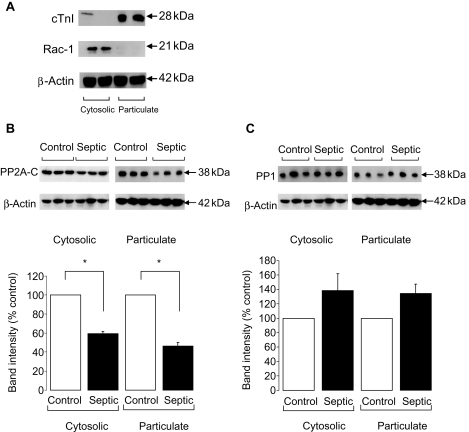
Figure 4.
(A) Representative blots showing fractionation of heart homogenate into cytosolic and particulate fractions using cardiac troponin I and Rac-1, respectively. (B) Representative blot and quantification of the amount of total protein phosphatase 2A (PP2A)-C in control and septic ventricular homogenates (n = 3 hearts/gp, *P < 0.05). (C) Representative blot and quantification of the amount of total PP1 in control and septic ventricular homogenates (n = 3 hearts/gp, P = ns). Band intensities are normalized to β-actin as a loading control.

