
Figure 2.
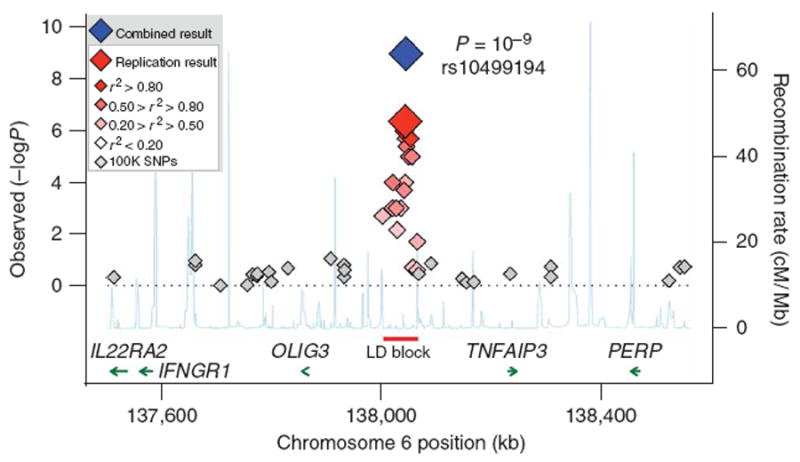
Case-control association results and linkage disequilibrium (LD) structure at 6q23. Results for SNPs genotyped across 1 Mb as part of the original GWA scan in 397 CCP+ rheumatoid arthritis cases and 1,211 related controls (gray diamonds), as well 17 SNPs genotyped in additional replication samples (2,283 unrelated CCP+ rheumatoid arthritis cases and 3,258 unrelated controls). In the replication samples, the color of each diamond is based on r2 (CEU HapMap) with the most significant SNP in our study (rs10499194). The blue diamond indicates the P value for all samples in our study (original GWA scan plus replication samples), as determined by Fisher's method of combining P values (EIGENSTRAT in both original GWA scan and replication samples). The recombination rate based on CEU HapMap is shown in light blue along the x axis (scale on the right); the red line indicates a 63-kb region of strong LD used to construct haplotypes. The green arrows indicate gene location; the associated SNP is ∼185 kb from either TNFAIP3 or OLIG3.