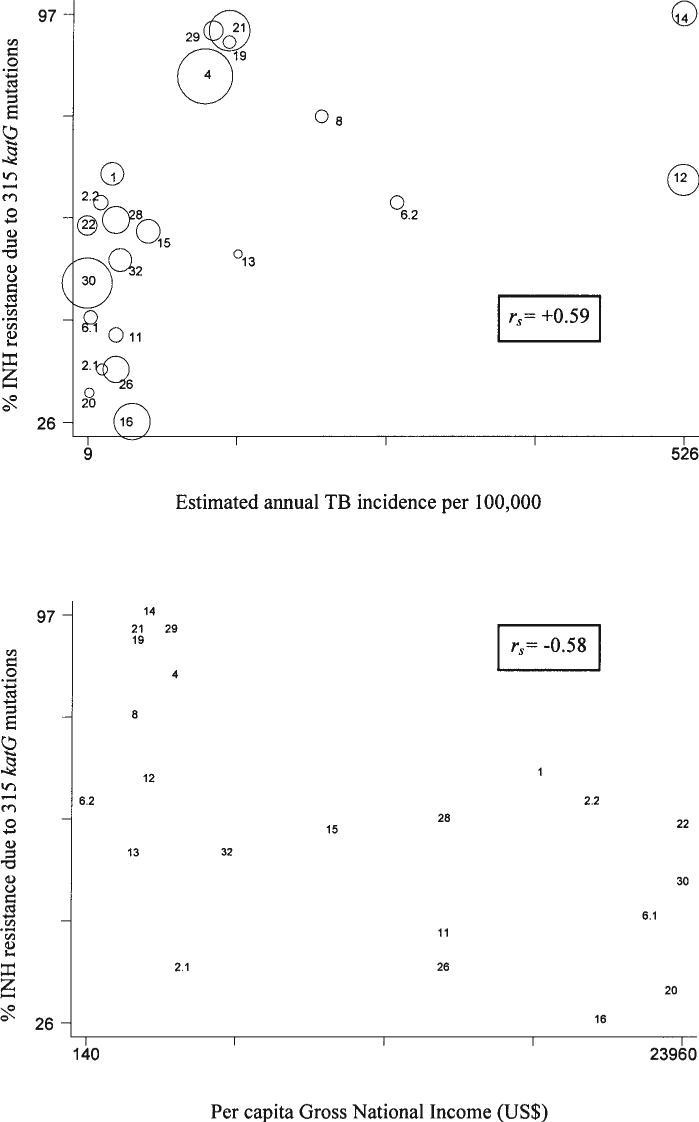
FIG. 1.
(Top) INH resistance due to 315 katG mutations and estimated incidence of tuberculosis by country. The areas of the circles are proportional to the sample size. Spearman correlation coefficients (rs) are given. (Bottom) INH resistance due to 315 katG mutations and estimated per capita Gross National Income by country. Data are provided in Table 1. Reference numbers, 1, Kuwait; 2.1, Lebanon; 2.2, UAE; 4, Lithuania; 6.1, Germany; 6.2, Sierra Leone; 8, Peru; 11, Spain; 12, South Africa; 13, Thailand; 14, South Africa; 15, South Korea; 16, Singapore; 19, Russian Federation; 20, Finland; 21, Russian Federation; 22, Netherlands; 26, Spain; 28, Spain; 29, Latvia; 30, Netherlands; 32, Mexico. Samples cited as 2.1 and 2.2 are from reference 2; samples cited as 6.1 and 6.2 are from reference 6.

