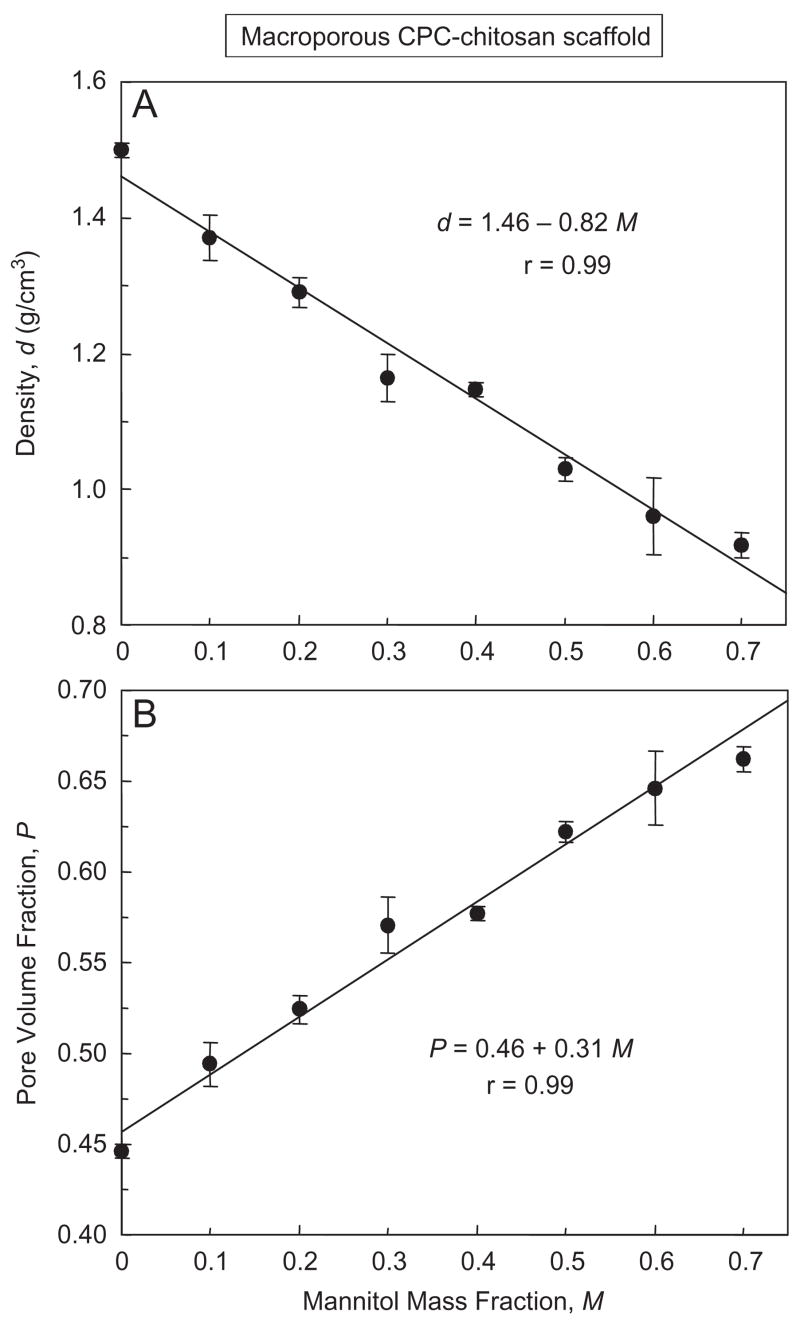
Fig. 5.
Effect of mannitol content on (A) density, and (B) porosity, of CPC–chitosan composite scaffold. Each value is mean±sd; n = 6, with the error bar showing one standard deviation. For the y-axis of (B), a pore volume fraction P of 65% is equivalent to 0.65. For the x-axis, a mannitol mass fraction of 70% is equivalent to 0.70. Lines are linear best fits to the data with correlation coefficient r = 0.99.

