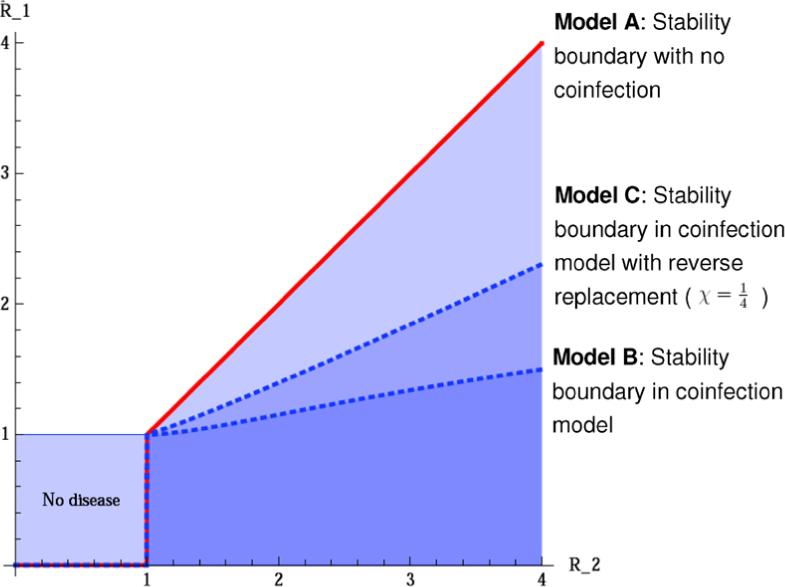
Fig. 2.

Stability of E2 in models A, B, and C. Parameters are k = 0.5, μ = 0.06, aq = 0.15, km = 0.4, μd = 1, χ = 0, (lower and upper dashed blue lines, respectively) and β1 and β2 are independent (and related to R1 and R2). The stability region of E2 is the area below the solid line (red) in the model without coinfection (model A) and below the curved dashed lines (blue) in model B, where the upper of these refers to the coinfection model with strain replacement (see Section 2.3). (Color figure online.)
