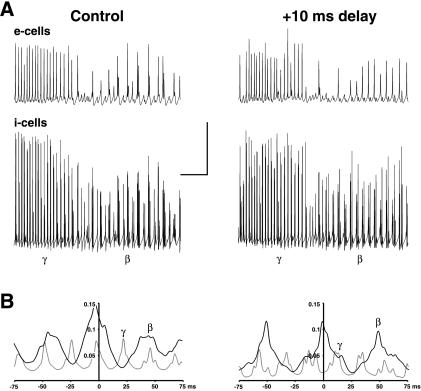
Figure 4.
In network model, beta remains synchronized with longer axonal delays than does gamma. The network consists of a 96 × 32 array of pyramidal cells (1.92 mm wide) and a superimposed 96 × 4 array of interneurons, as in ref. 14. In control conditions, the maximum axon conduction delay was 3.84 ms across the array. Oscillations were evoked by tonic depolarization of both pyramidal cells (E-cells) and interneurons (I-cells), with the gamma → beta transition occurring as pyramidal cell AHP conductances and excitatory postsynaptic potential conductances simultaneously increase (10, 18). In the case shown on the right, all axonal signals crossing the midline of the array were subjected to an additional 10-ms delay. (A) Gamma, followed by beta, as plotted in simultaneous traces of local average signals (224 nearby E-cells, 28 nearby I-cells). The E-cell signals appear similar, with and without the extra 10-ms delay. During beta, both E- and I-cell traces reveals an underlying oscillation at gamma frequency. (Bars = 20 mv, 200 ms.) (B) Cross-correlations of local average E-cell signals from opposite ends of the array, for 200 ms of gamma (thin lines) and 800 ms of beta (thick lines). In the control case, both gamma and beta have cross-correlation peaks within 3 ms of 0. With the extra 10-ms conduction delay, the gamma signal is almost anticorrelated between the two sites whereas the beta signal cross-correlation peak is at −1.4 ms.

