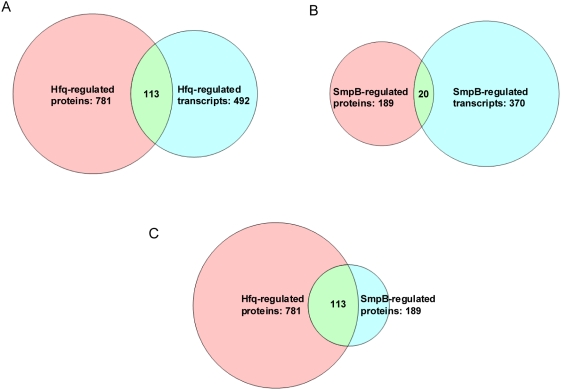
Figure 3. Summary of transcriptional and translational control functions of Hfq and SmpB.
Venn diagram showing overlap between transcripts and proteins regulated by Hfq (Panel A), between transcripts and proteins regulated by SmpB (Panel B) and between proteins co-regulated by Hfq and SmpB (Panel C) across all growth conditions.

