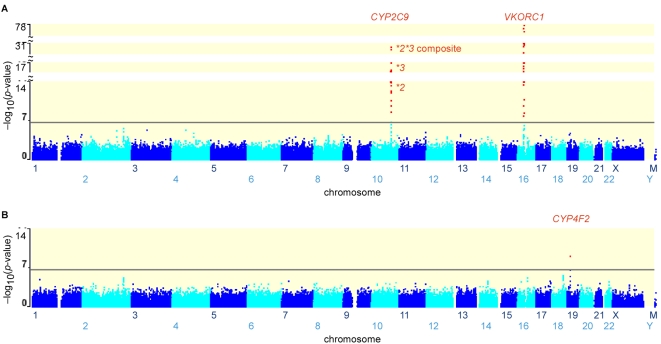
Figure 1. P-values for each GWAS SNP tested for association with warfarin dose.
Horizontal axis shows SNP location and vertical axis is −log10(p-value) for each SNP tested by univariate regression (A) or multivariate regression (B). Red dots and red lettering show SNPs and implicated genes with p-values beyond the genome-wide significance threshold (1.5×10⁻⁷) which is denoted by a horizontal line. (A) Univariate regression shows genome-wide significant association to SNPs clustering near the warfarin drug target VKORC1 (e.g., P = 5.4×10−78, rs9923231) and near the warfarin-metabolizing gene CYP2C9 (P = 4.5×10⁻¹⁷ for non-synonymous *3 SNP rs1057910, P = 8.8×10⁻¹³ for non-synonymous *2 SNP rs1799853, P = 3.1×10−31 for *2*3 “composite” SNP rs4917639). (B) Multivariate regression adjusting for the contributions of VKORC1 and CYP2C9 had greater power than univariate regression and detected genome-wide significant association to the CYP4F2 gene (P = 8.3×10⁻¹⁰, non-synonymous SNP rs2108622).

