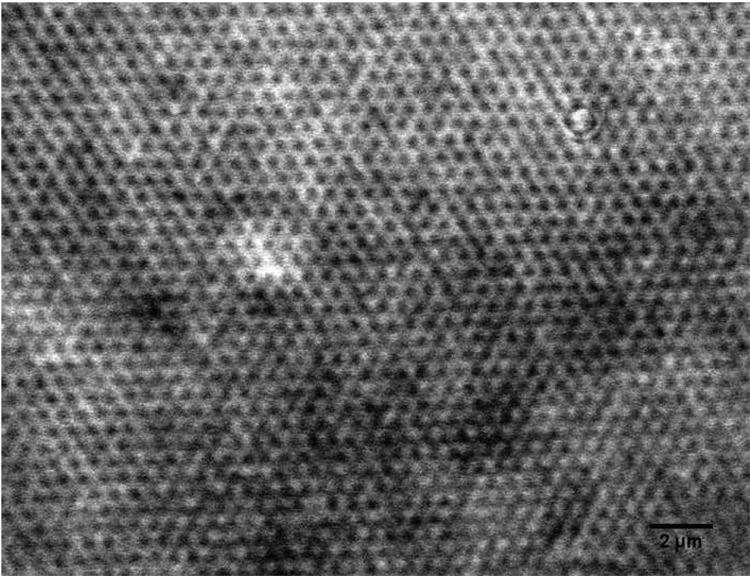
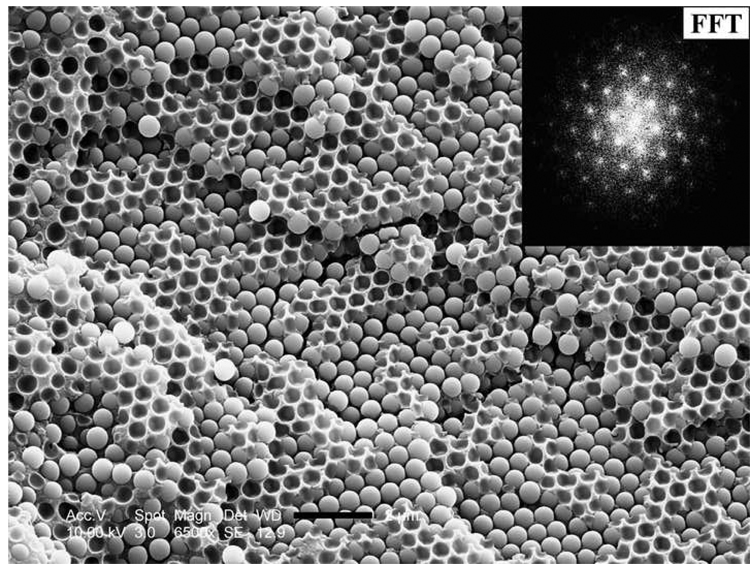
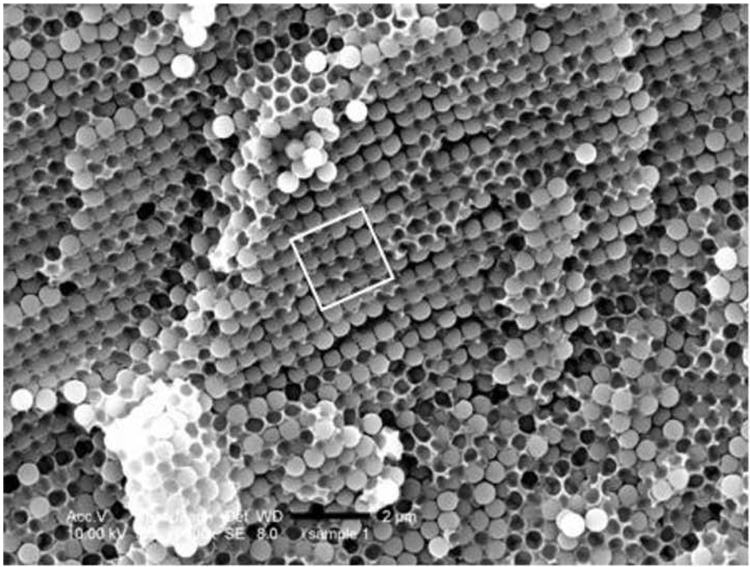
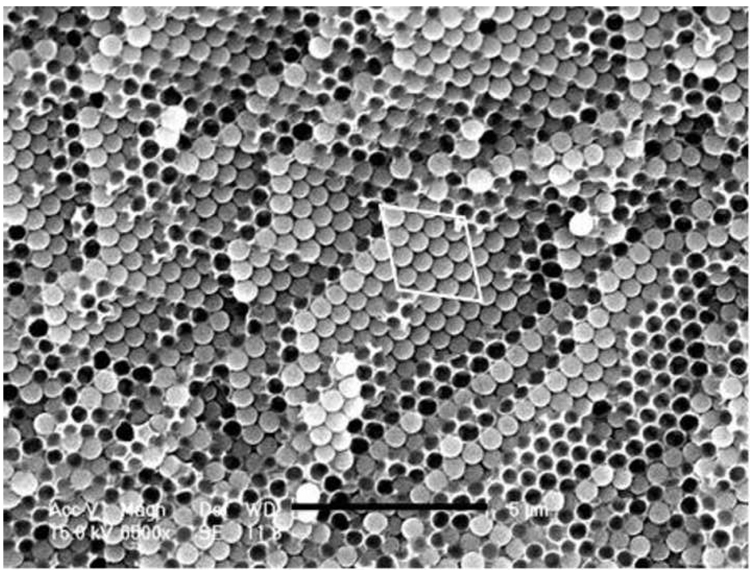
Figure 4.
a) Optical microscope picture of silica spheres (500 nm, 60 wt%) dispersed in TEGDMA, scale bar 2 microns. SEM micrographs (fracture surfaces) of (b) a cured wet colloidal crystal (60 wt% MPS-silica in TEGDMA), scale bar 1 micron. The inset shows the fast Fourier Transform (FFT) of the image; (c) a cured sample of synthetic opal featuring the (100) plane of the fcc ordered sample, scale bar 2 microns; (d) a cured sample of synthetic opal featuring the (111) plane of the fcc ordered sample, scale bar 5 microns.


