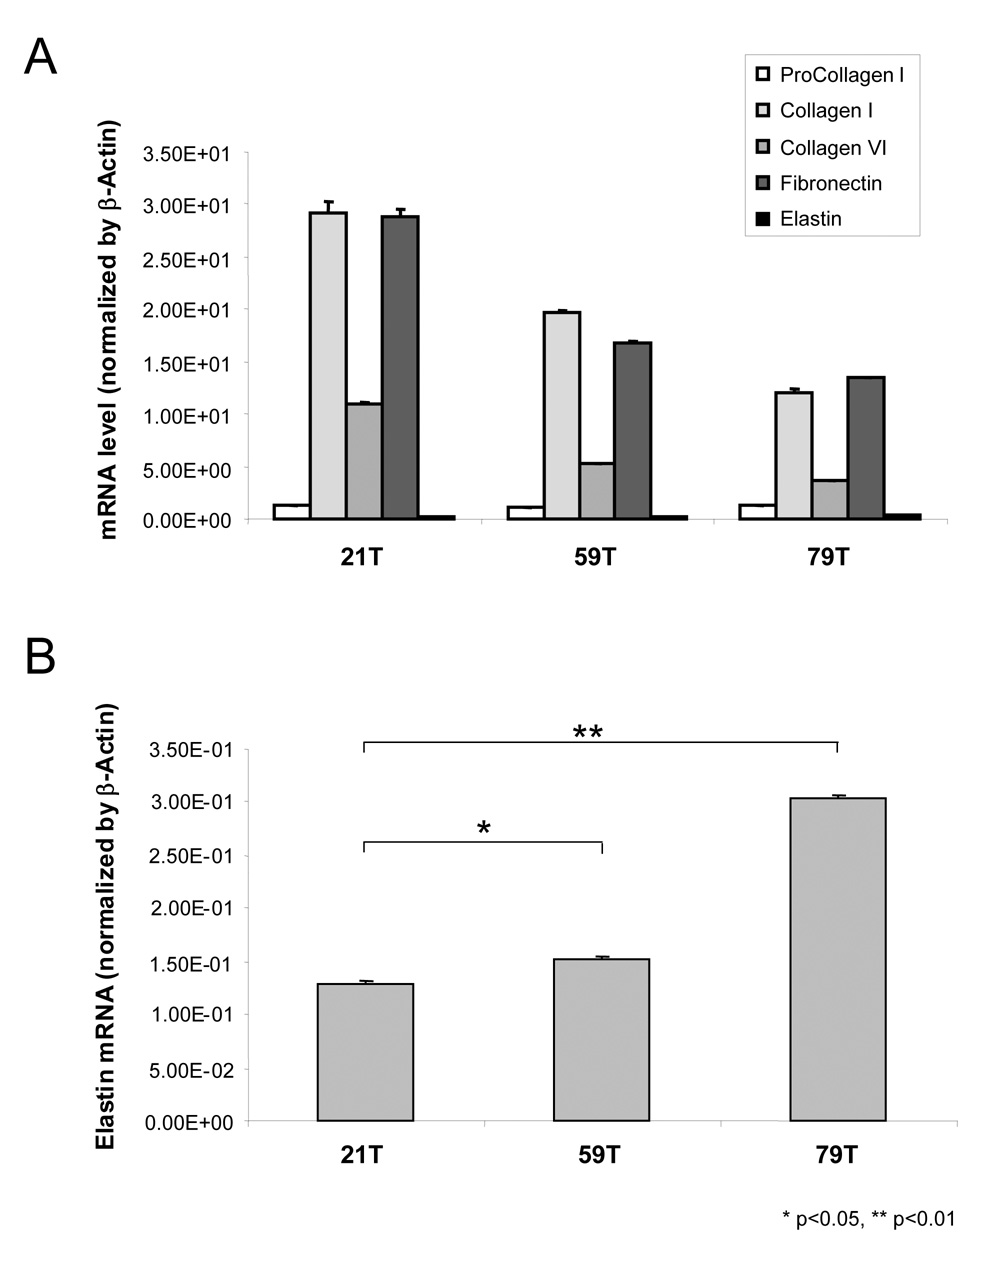
Figure 4. Gene expression of 21T, 59T and 79T hVFF.
(A) Expression of procollagen I α-1, collagen I α-2, collagen VI α-3, finbronectin and elastin genes in 21T, 59T and 79T hVFF cells. (B) Gene expression of elastin in 21T, 59T and 79T hVFF cells. All of data were normalized to β-Actin. The graph shows the ratios of each gene expression in 21T, 59T and 79T. Values are the mean ± SD of results of triplicate test.

