
Figure 3.
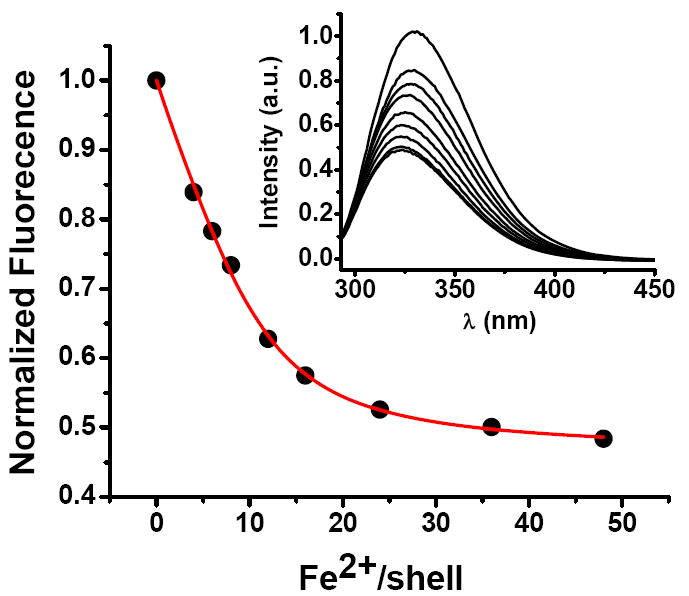
Fluorescence quenching upon Fe2+ binding anaerobically to variant #1. Inset: Family of spectra. The red line is the fit of eq 1 to these data with nF = 11.7 ± 0.7, KF = (1.1 ± 0.2) × 106 and I∞ = 0.460 ± 0.009 (95 % confidence level). The average and standard deviations obtained for four titrations are nF = 11.4 ± 2.1 and KF = (1.3 ± 0.8) × 106 M-1. Conditions: λEx. = 280 nm, λEm. = 324 nm, slits for excitation and emission of 4 and 8 nm, respectively, 1.0 μM apo-protein, 0 – 48 μM FeSO4, 50 mM Mops, pH 7.15, 25 °C.