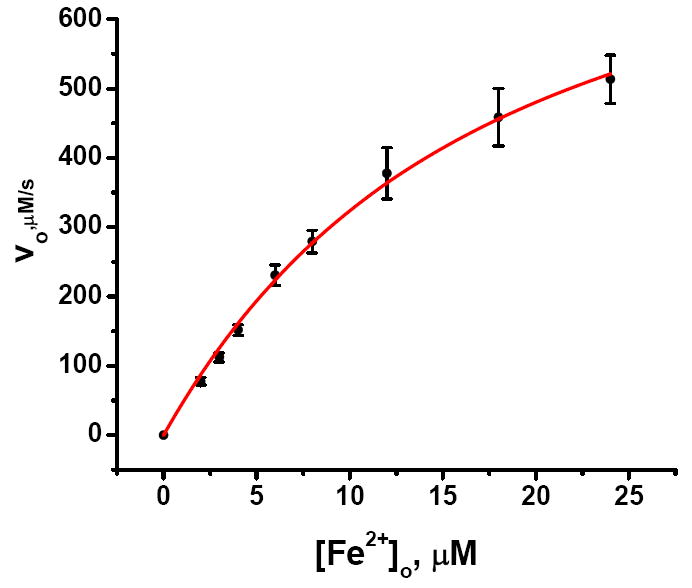
Figure 7.

Plot of the initial velocity v0 for Fe2+ arrival at the ferroxidase center versus total Fe2+concentration. The initial velocity v0 is given by vo (μM/s) = α·kobs·(Io-I∞) where the values of kobs(s-1) and Io- I∞ are from curve fitting of each kinetic trace in Figure 6. Error bars are from the propagated errors in kobs and Io-I∞. α is the proportionality constant between the maximal concentration of Fe2+ bound at the ferroxidase centers and the maximal degree of fluorescence quenching, Io-I∞, namely α = 6μM Fe2+/0.54 = 11.1 μM (Supporting Information). Fitting of the unweighted data (red line) according to eq 3 with the concentration of channels [C]o = 4 μM gives KC = (7.0 ± 0.7) ×104 M-1 and kd = 216 ± 12 s-1 (95% confidence level).48
