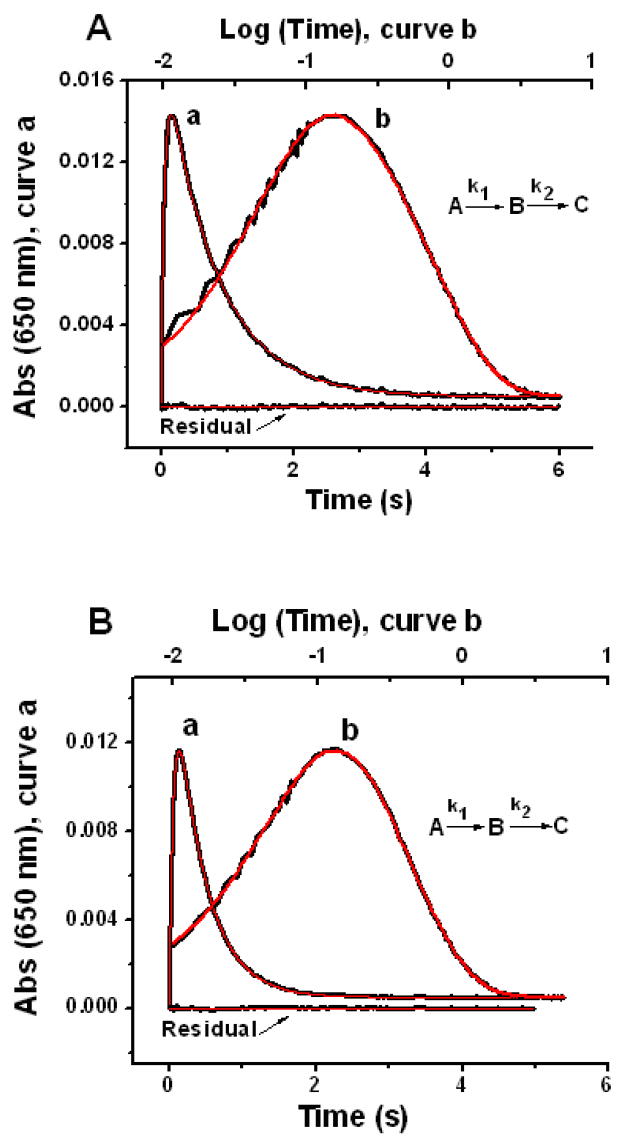
Figure 9.

Stopped-flow absorbance versus time (curve a) and log(time) (curve b) for O2 oxidation of Fe2+ prebound to variants #1 (panel A) and #2 (panel B) containing 48 Fe2+/shell. Fitted curves are shown in red. The rate constants from curve-fitting are: k1 = 18.4 ± 0.4 s-1 and k2 = 1.29 ± 0.02 s-1 for variant #1 (Fig. 9A); k1 = 17.5 ± 0.6 s-1 and k2 = 2.49 ± 0.06 s-1 for variant #2 (Fig. 9B) from eq 6 with the equations for the concentrations of species given elsewhere.31 The stated rate constants and associated errors are averages and standard deviations, respectively, from curve fits to three separate kinetic runs. The residual is the difference between the fitted and experimental linear time curves. The conditions are the same as in Figure 8.
