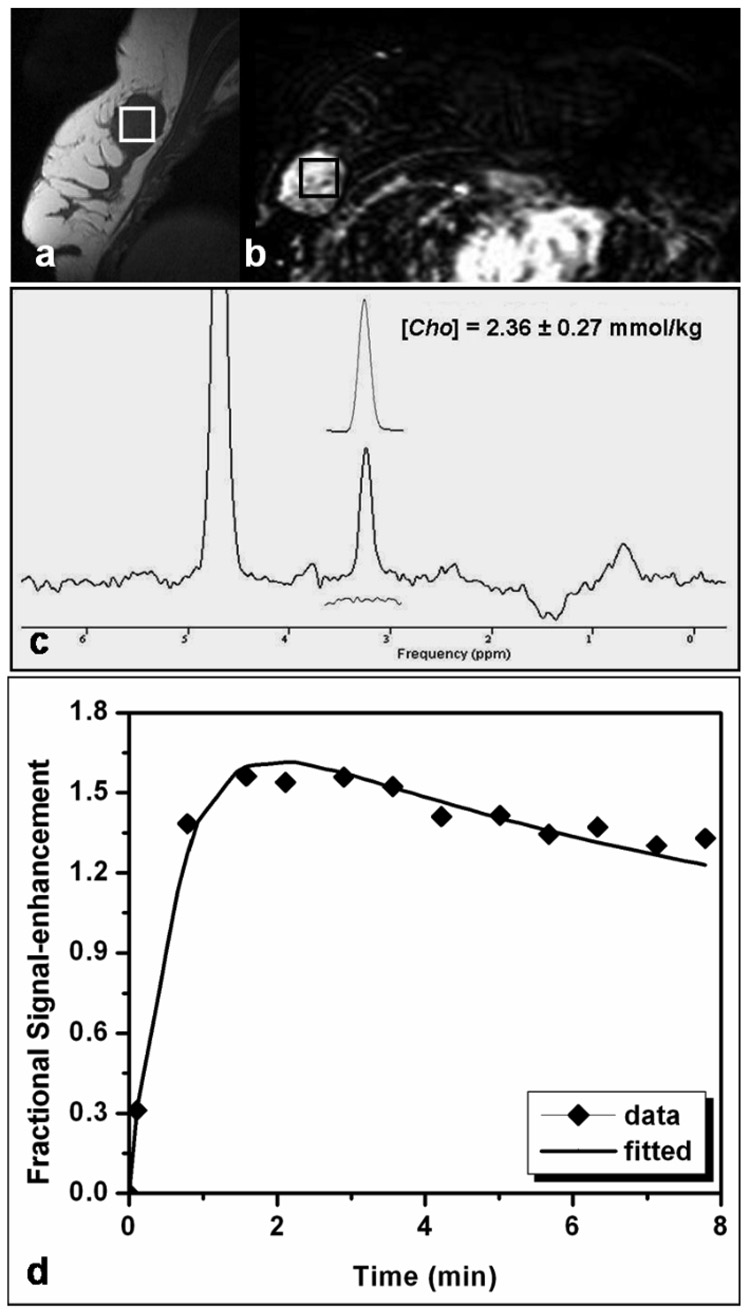
Figure 2.
MRI and MRS measurements in a patient with a mass type lesion. The pre-contrast sagittal image of one lesion showed low signal intensity. The spectroscopic voxel (size, 2 × 2 × 2 cm3) is placed in the hypointense lesion on the pre-contrast sagittal image (a) and on the contrast-enhanced lesion in the subtraction image (b). A Cho peak at 3.22 ppm is clearly visible in the water-fat suppressed spectrum (c). The Gaussian model fitting of the Cho peak produces a measurement of [Cho] = 2.36 ± 0.27 mmol/kg. The estimated model fit is shown above the full spectrum and the residue is shown underneath. The corresponding DCE MR imaging kinetics from the MRS voxel labeled in Fig. 2(a) and 2(b) is shown in Fig. 2(d). The symbol is the experimentally measured enhancement percentage, and the line is the best-fitting result using the 2-compartmental pharmacokinetic model.

