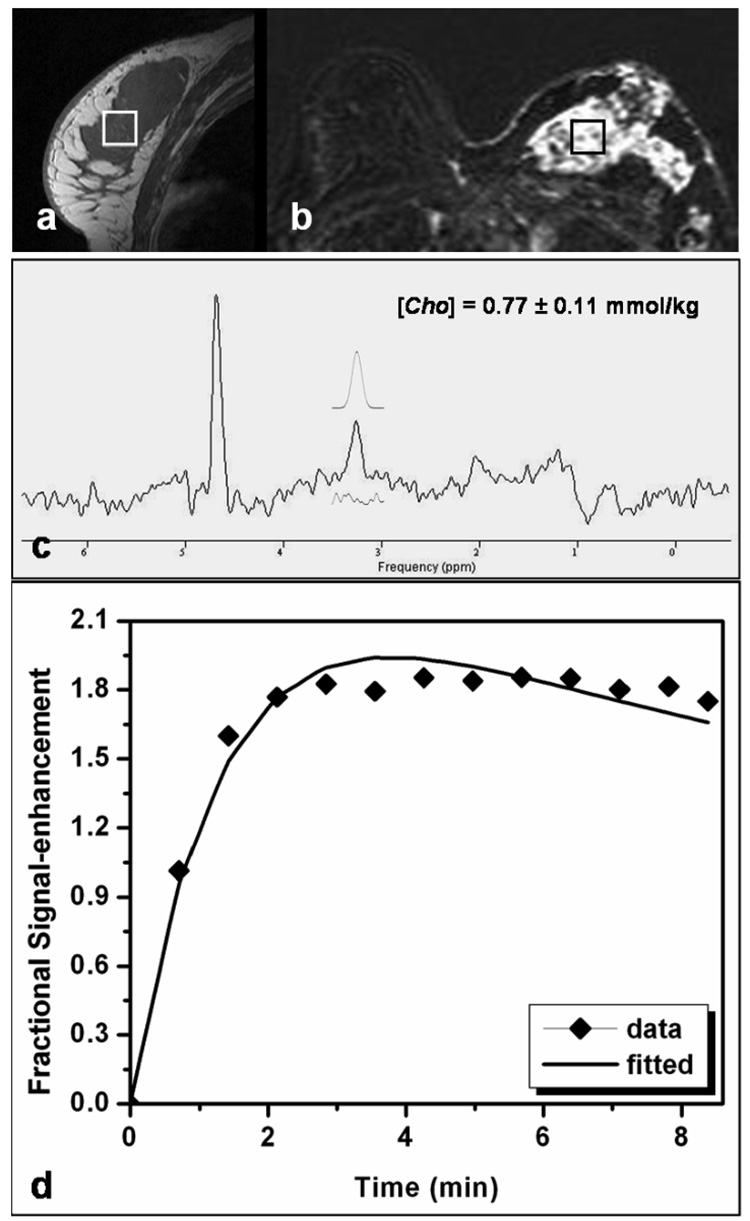
Figure 3.
MRI and MRS measurements in a patient with a diffuse-type lesion. The spectroscopic voxel (size, 2 × 2 × 2 cm3) is positioned within the large hypointense lesion on the pre-contrast sagittal image (a) as well as in the enhanced lesion on the subtraction image (b). A Cho peak is visible on the water-fat suppressed spectrum (c), with [Cho] = 0.77 ± 0.11 mmol/kg. Among all subjects, this patient had the lowest Cho concentration. The corresponding DCE MR imaging kinetics is shown (d), symbols for measured enhancement percentage, and the line for the best fitting results.

