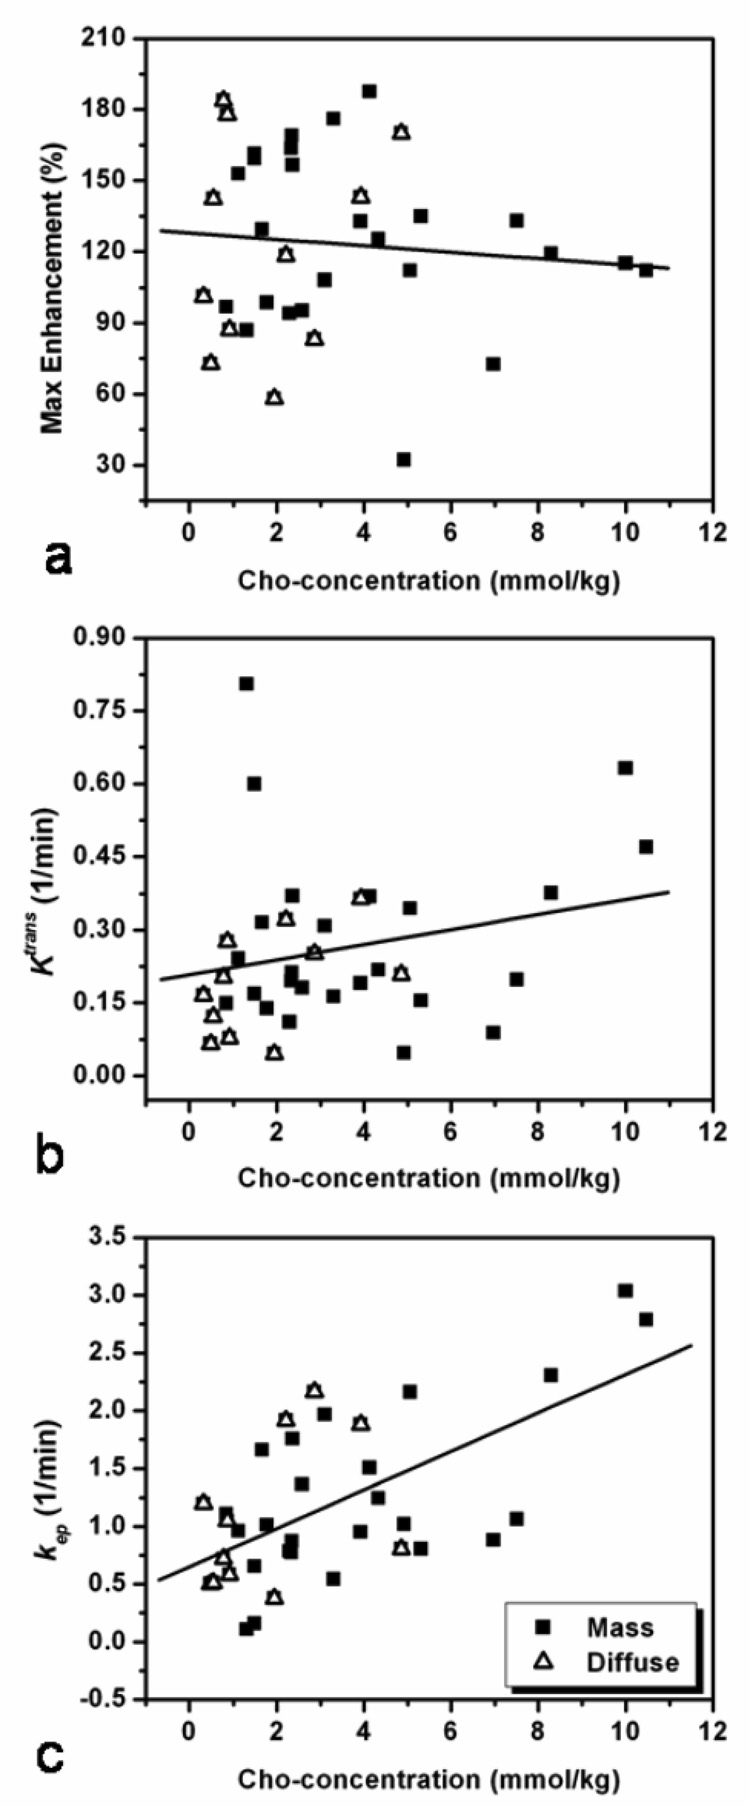
Figure 4.
Correlation between the Cho and DCE MR imaging parameters SE-2min%, Ktrans, and kep among 36 lesions in 32 patients. Lesions of different morphology, mass or diffuse, are labeled with different symbols, but analyzed together. The Cho level is not correlated with the SE-2min% (r = −0.008, p = 0.639) (a), or wash-in rate Ktrans (r = 0.216, p = 0.211) (b), but has a significant correlation with the wash-out rate kep (r = 0.62, p < 0.0001) (c).

