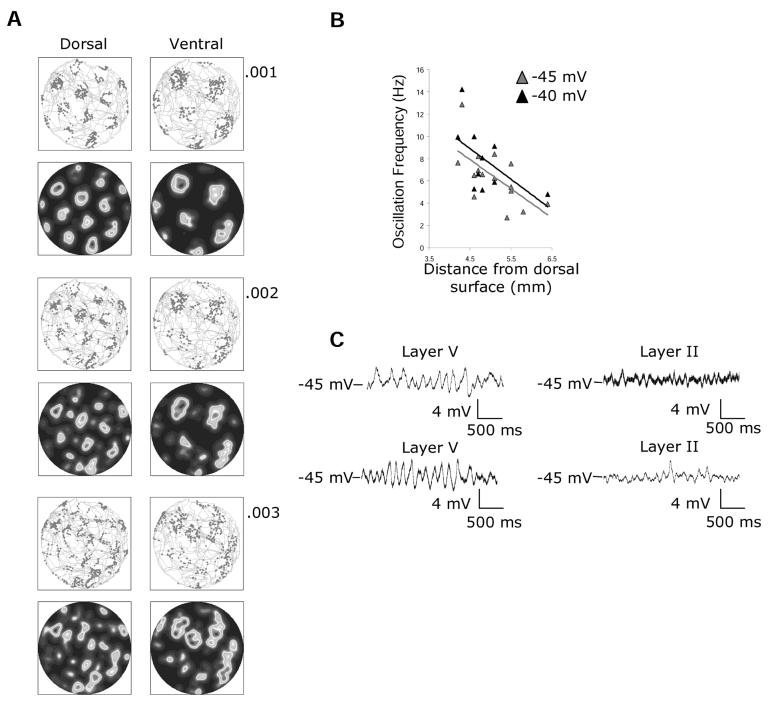
Figure 6.
A. Effects of noise in the oscillatory model. As the noise levels in the model are increased, the firing of the simulated grid cell becomes less consistent and loses its grid pattern of spatial periodicity. B. Layer V cells show higher frequency membrane oscillations in dorsal compared to ventral portions of medial entorhinal cortex at a membrane potential of −45 mV and −40 mV. C. Qualitative differences between m-current (layer V) and h-current (layer II) dependent subthreshold oscillations. Two different layer V cells (left; top 4.2 mm from dorsal surface, bottom 4.7 mm from the dorsal surface) show higher amplitude oscillations compared to two different layer II cells (right; top 4.4 mm from dorsal surface, bottom 4.6 mm from dorsal surface).

