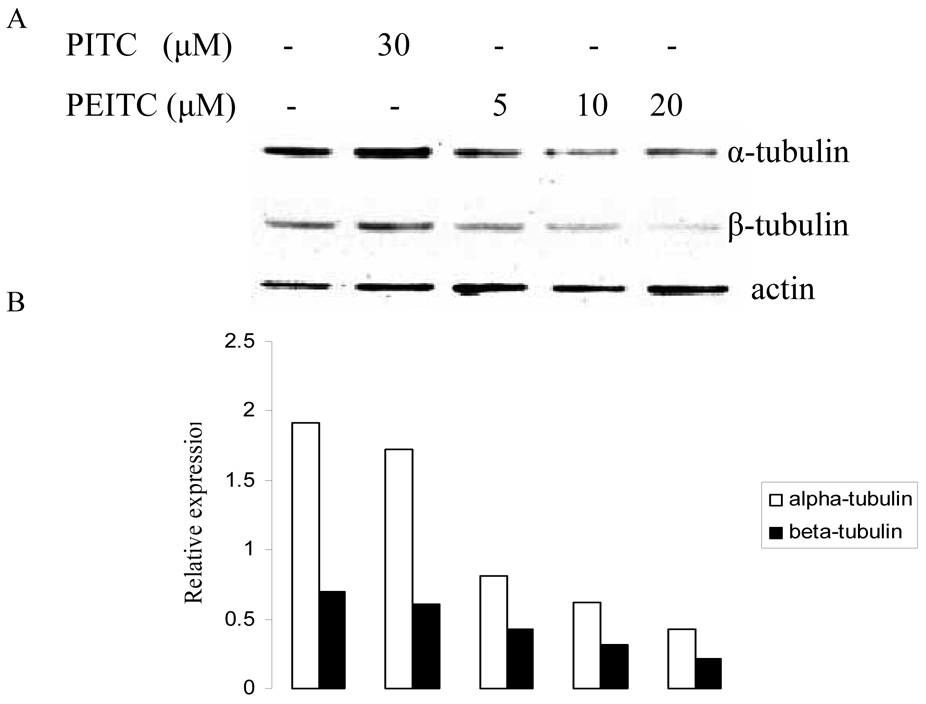
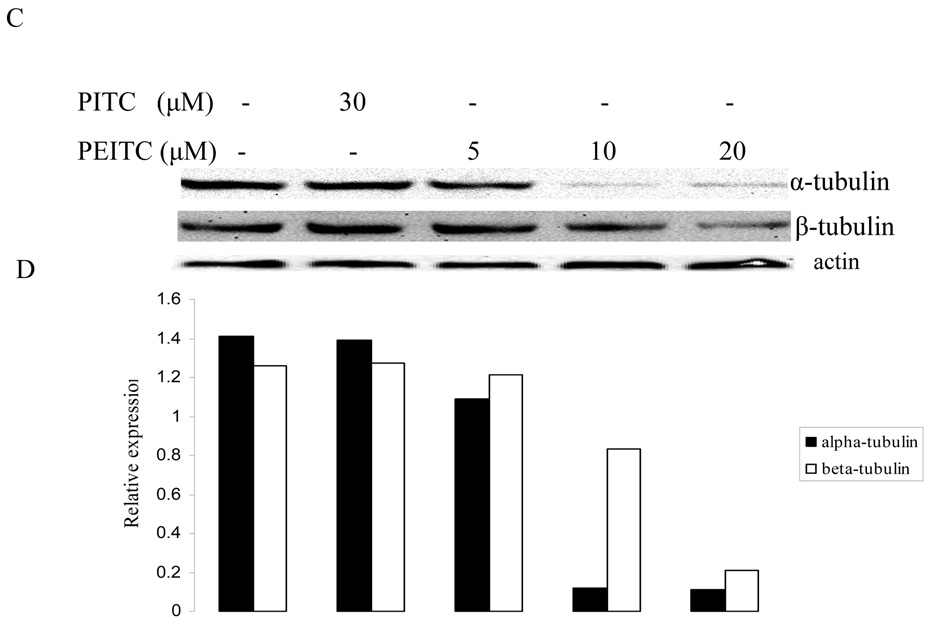
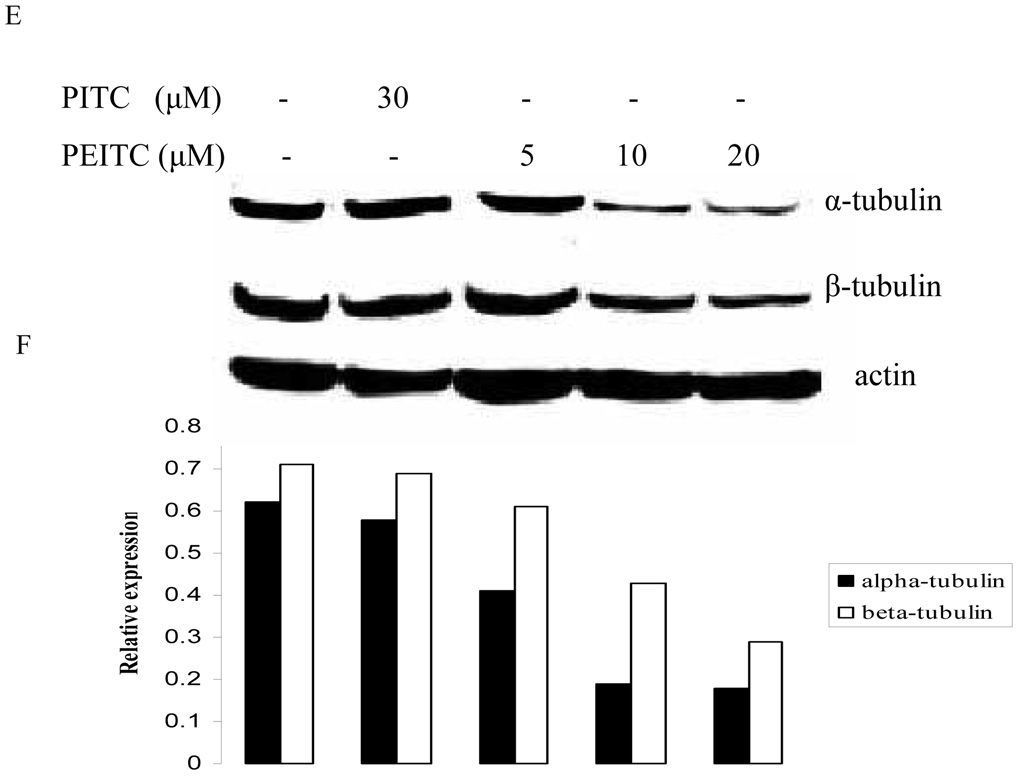
Figure 1.
Effects of PITC and PEITC on tubulin expression in PC-3 cells. Cells were treated by PITC (30 µM), or PEITC (0, 5, 10, or 20 µM) for 2 h (A), 8 h (C), or 24 h (E). Actin was used as an internal control for protein loading and transfer efficiency, (B), (D), (F) Densitometric measurements of tubulin expression levels were normalized to internal controls and are expressed in relative units


