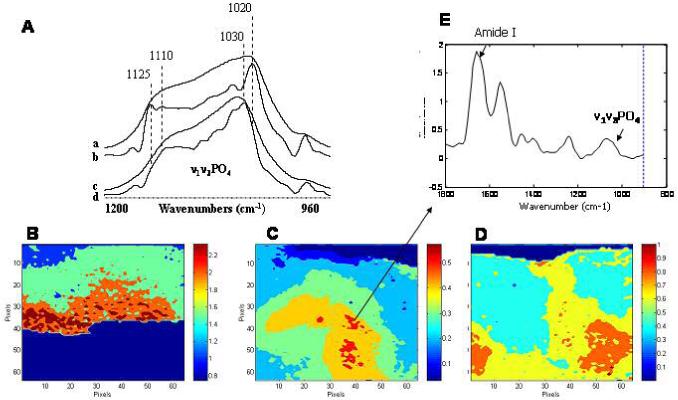
Figure 4.

Fourier Transform Infrared Analysis of mineral formed in culture. Infrared spectroscopy can be used to characterize the mineral formed in culture. A) The phosphate absorption band observed in the odontoblast M2H4 cell line maintained in culture for days 8-21 with 10 ng TGFbeta 1, 100 ng/ml BMP-4, and 3 mM inorganic phosphate (a), when deconvoluted to reveal underlying peaks (b), resembles that obtained from a dentin slice (c) and its deconvoluted spectrum (d). The subbands at 1125 and 1020 cm-1 are characteristic of an immature hydroxyapatite rich in acid phosphate and carbonate substituents. Generously provided by Professor J. Guicheux and D. Magne. Details of the culture system are in reference 76. B) By attaching an array detector to the infrared microscope, images corresponding to each of the parameters of interest can be obtained. FTIR spectroscopic imaging of the mineral/matrix ratio in a mineralizing chick limb-bud micromass culture at day 21 showing the distribution of mineral. These cells were maintained in DMEM with 1.4 mM calcium and 4 mM inorganic phosphate plus antibiotics and 40 uM ascorbate. C) FTIR spectroscopic image of the mineral/matrix ratio in a “bone nodule” formed in an osteoblast culture at day 14. The cells were cultured with alpha -MEM containing ascorbate, vitamin D, and a total of 3 mM inorganic phosphate. Note the mineral/matrix ratio in the day 21 chondrocytes is higher than thatin the 14 D osteoblast culture. D) Image showing the distribution of crystal size (and perfection (in the culture illustrated in figure C. E) Spectrum corresponding to the pixel indicate in C is shown in figure 3. The amide I and phosphate bands are noted.
