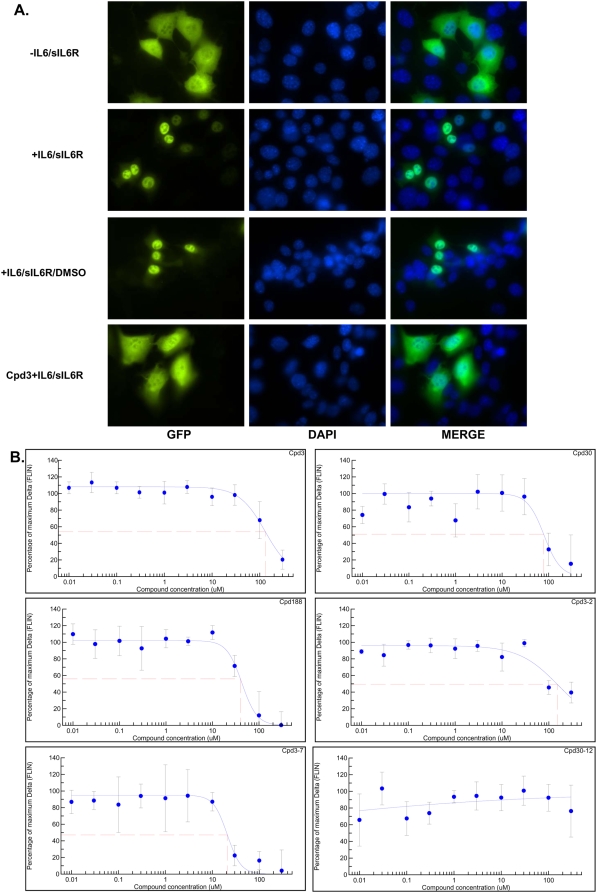
Figure 4. Inhibition of cytoplasmic-to-nuclear translocation of Stat3 assessed by confocal and high-throughput fluorescence microscopy (HTFM).
In panel A, MEF/GFP-Stat3 cells grown on coverslips were pretreated with DMSO that either contained (row four) or did not contain (row three) Cpd3 (300 µM) for 60 min before being stimulated without (row one) or with IL-6 (200 ng/ml) and IL-6sR (250 ng/ml) for 30 minutes (rows two, three and four). Coverslips were examined by confocal fluorescent microscopy using filters to detect GFP (column one), DAPI (column two) or both (merge; column three). In panel B, MEF-GFP-Stat3 cells were grown in 96-well plates with optical glass bottoms and pre-treated with the indicated compound at the indicated concentrations in quadruplicate for 1 hour then stimulated with IL-6 (200 ng/ml) and IL-6sR (250 ng/ml) for 30 minutes. Cells were fixed and the plates were examined by high-throughput microscopy to determine the fluorescence intensity in the nucleus (FLIN). The percent of maximum change (delta, Δ) in FLIN was calculated as described in the Methods and plotted as a function of the log of the compound concentration. Data shown are mean±SD and are representative of 2 or more experiments. Best-fit curves were determined using 4-Parameter Logistic Model/Dose Response/XLfit 4.2, IDBS software and were used to calculate the IC50 values (Table 2).

