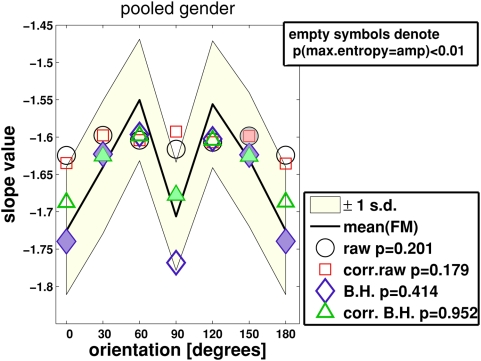
Figure 6. Slopes.
Symbols denote oriented spectral slopes  from the four amplitude spectra
(circles = raw,
squares = corrected raw,
diamonds = Blackman-Harris (B.H.), and
triangles = corrected B.H. –
see methods section and Figure 1). The solid
curve centered in the light-colored area denotes maximum entropy
slopes
 of feature map amplitudes (label “mean
(FM)”). The light-colored area indicates ±1
standard deviation. Open symbols indicate where spectral slopes and
maximum entropy slopes are significantly different from each other
(one-way ANOVA at each orientation,
  ). Filled symbols denote the opposite case (
 ). A further ANOVA test served to compare whether
orientation-averaged slope values were drawn from the same underlying
distribution. The respective probabilities are
  (raw spectrum versus maximum entropy slopes),
  (corrected raw),
  (B.H.), and
  (corrected B.H.). Notice that slope values in the
angular domain from 180° to 360° are equivalent to those
being shown.

