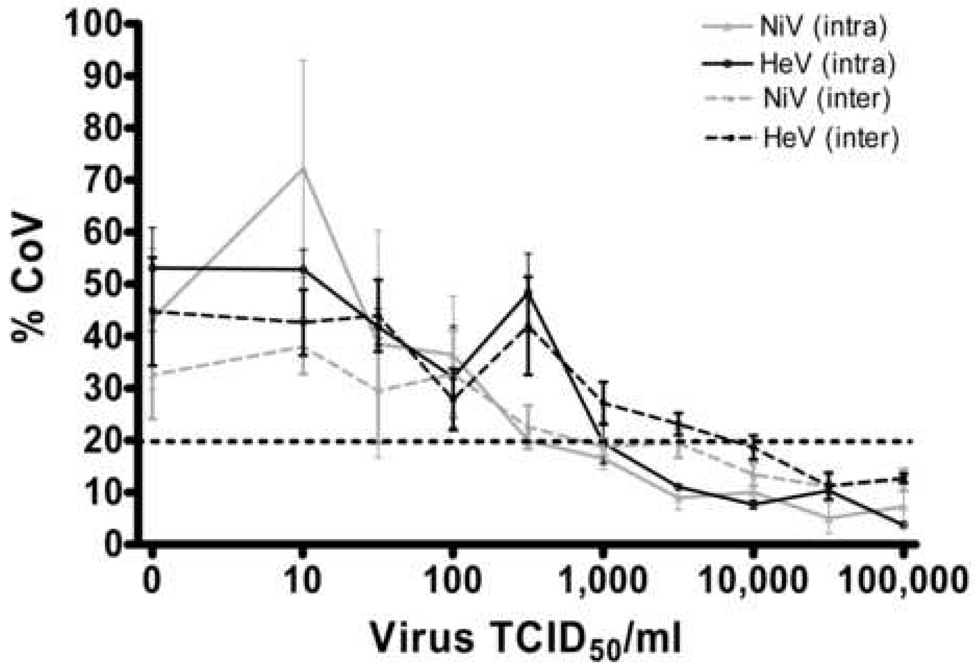
Figure 4. Effect of virus concentration on assay coefficient of variation.
½ log dilutions of NiV and HeV were incubated, immunolabeled and detected as described in Figure 1 (24 hours, HRP-CL). Coefficient of variation is plotted against virus concentration. Intra assay values are averages of 3 plates containing 6 replicates. Inter assay values are averages of 6 replicates. Values are expressed as the Mean +/− S.E.

