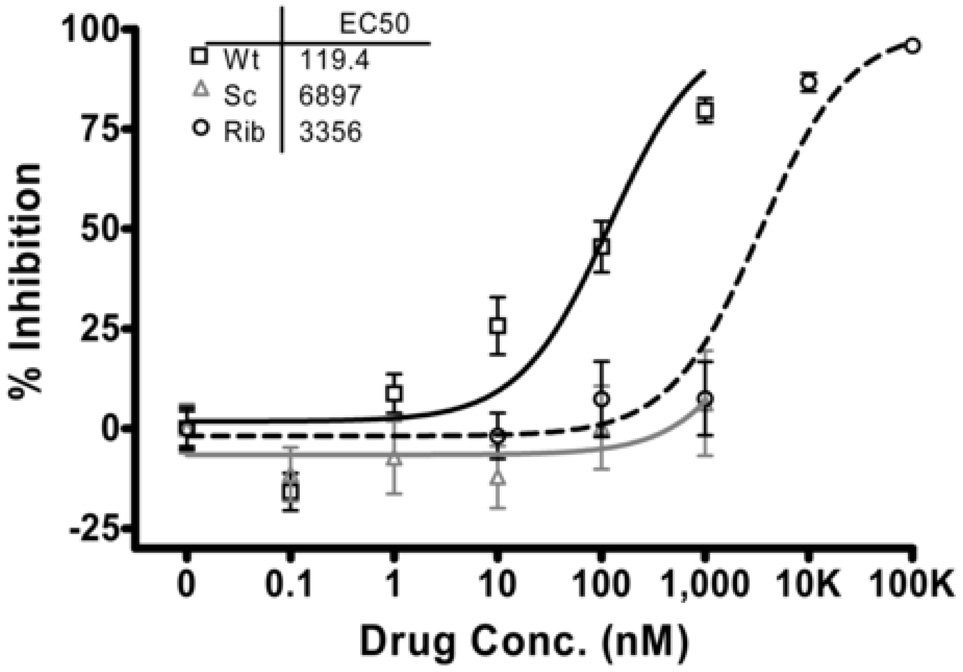
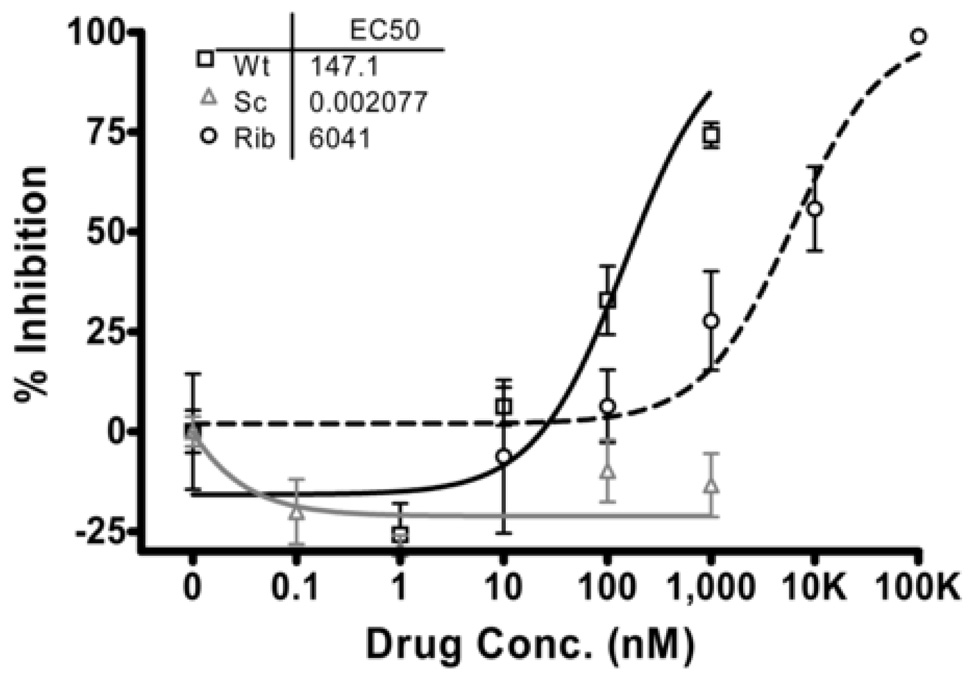
Figure 5. Evaluation of Henipavirus inhibitors using HRP-chemiluminescent (a) and fluorescent (b) detection.
NiV (m.o.i.= 0.25) was inoculated onto Vero cells preincubated with log dilutions of HPIV3 F protein derived peptide (Wt), Scrambled HPIV3 F peptide (Sc) or Ribavirin (Rib), incubated for 24 hours at 37°C and 5% CO2 then fixed, immunolabeled and detected as described in Figure 1 (HRP-CL). % inhibition was determined compared to untreated, infected wells and values are expressed as the Mean +/− S.E (n=8 replicate wells). Non-linear regression analysis was performed (GraphPad Prism) to determine the 50% inhibitory concentration (IC50).


