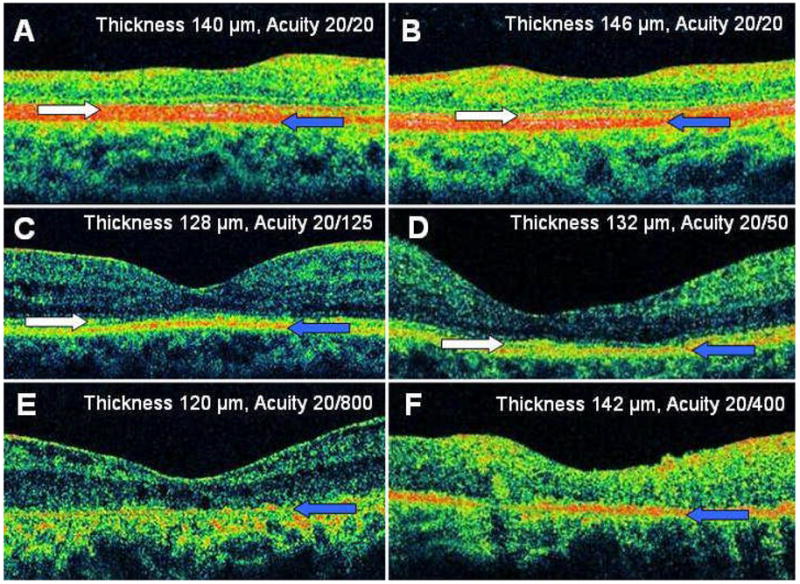
Figure 3. Representative High-Definition Optical Coherence Tomography Images Demonstrating Varying Degrees of Macular Atrophy.

The right eye (A) and left eye (B) of patient 20 had an intact photoreceptor layer, while the photoreceptor outer segments appeared attenuated. The right eye of patient 17 (C) and the left eye of patient 1 (D) had a partially intact photoreceptor layer. The left eye of patient 11 (E) and the right eye of patient 5 (F) had an absent photoreceptor layer. White arrow indicates hypereflective line corresponding to the photoreceptor layer, while the blue arrow indicates the hypereflective line corresponding to the RPE. Images represent horizontal line scans through center of fovea.
