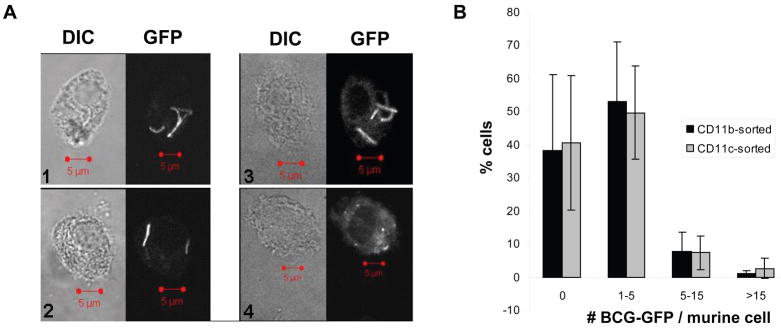
Figure 4. Fluorescence microscopy of BCG-GFP+ cells obtained by FACS.
A. Paired differential interference contrast (DIC) and fluorescence microscopy (GFP) images of cells from the R6 gate that contained BCG-GFP (panels 1–3) and one example (panel 4) of a highly autofluorescent cell with granules that represents an apparent false GFP+ event (4). Bars = 5 microns. B. Cells from gate R6 were scored by fluorescence microscopy for the number of mycobacteria/cell. Each data point represents the mean +/− SD from 3 independent experiments (50–225 cells were scored for each experiment).

