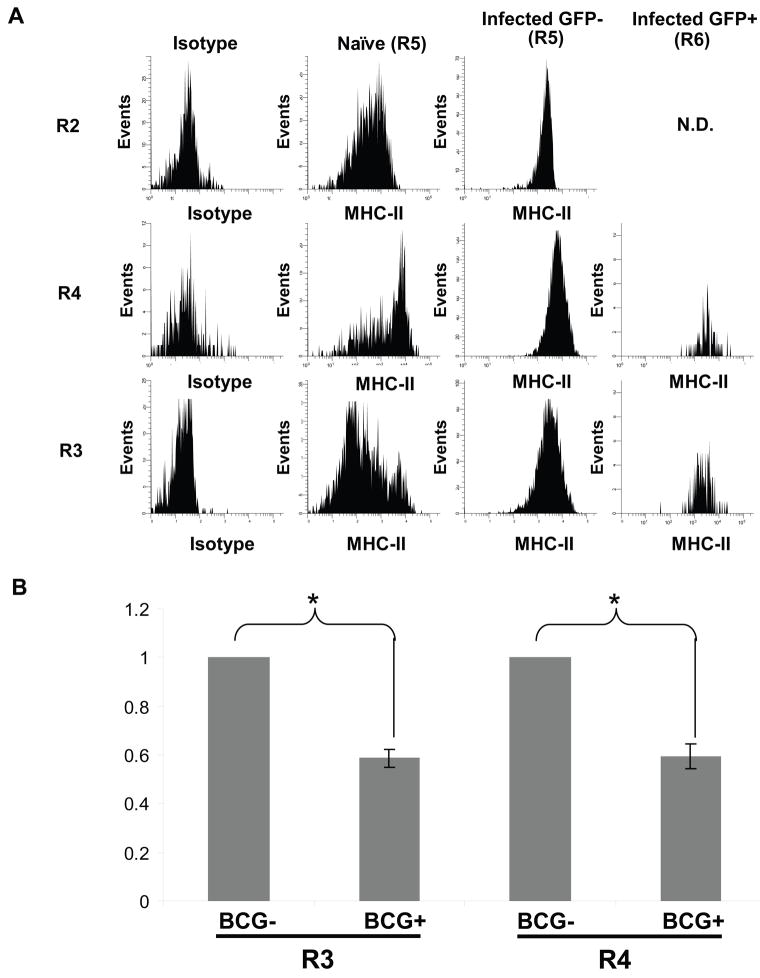
Figure 6. Pulmonary infection increases mean MHC-II expression on lung APCs, but MHC-II is decreased on APCs that harbor mycobacteria.
CD11b or CD11c affinity-sorted cells were prepared from naïve or BCG-GFP-infected lungs. APC subsets were defined as in Fig. 3. CD11bneg-low/CD11cmid-high cells were analyzed from CD11c affinity-sorted cells; CD11bhigh/CD11chigh and CD11bhigh/CD11cneg-mid cells were analyzed from CD11b affinity-sorted cells (n.d. = not determined due to insufficient number of infected cells). A. Isotype control antibody staining (gray filled curve) or anti-MHC-II staining of BCG-GFP− (R5) APCs and BCG-GFP+ (R6) APCs from the same infected lungs. Each sample represents cells pooled from 5 mice. MFI for MHC-II is indicated on each histogram. B. MHC-II fold-change between BCG-GFP− and BCG-GFP+ cells in R3 and R4 from the same infected lungs. Data has been normalized to BCG-GFP+ samples. Data represents the average of 3–4 experiments, each containing cells pooled from 5–10 mice. Asterisks (*) indicate statistical significance (p < 0.05) as determined by t test (see Methods).

