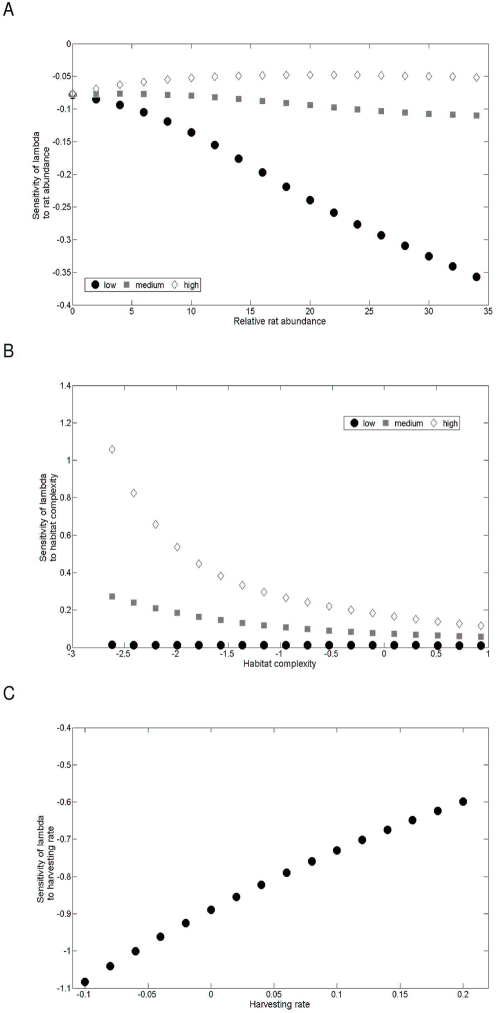
Figure 2. Sensitivity analysis.
Sensitivity of lambda to (A) rat abundance for high (◊), medium (▪) and low (•) habitat structure, (B) habitat structure for high (◊), medium (▪) and low (•) rat density, and (C) to hazard rate with habitat structure and rat density set to their average levels. In all graphs survival is set to the value estimated from individual encounter histories (0.87). A change in hazard rate shows by far the highest sensitivity than a change in rat density and habitat structure.

